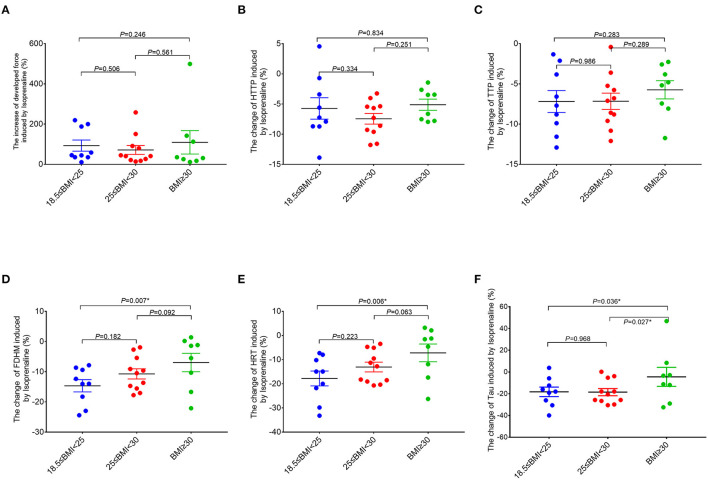
Figure 4.
Comparisons of the response of the right atrial trabeculae to isoproterenol between the groups (normal group, n = 9; overweight group, n = 11; obese group, n = 8). In comparison to the normal group (18.5 kg/m2 ≤ BMI < 25 kg/m2), the ranges of changes of FDHM, HRT, and Tau caused by isoproterenol in the obese group (BMI ≥ 30 kg/m2) are significantly smaller (by using the X-axis zero point as the reference line). *Compared to the obese group (BMI ≥ 30 kg/m2), p < 0.05. All the data are normalized to baseline. Data are expressed as mean ± SEM. BMI, body mass index; HTTP, half time to peak force; TTP, time to peak force; FDHM, full duration at half maximum; HRT, half relaxation time; Tau, relaxation time constant.

