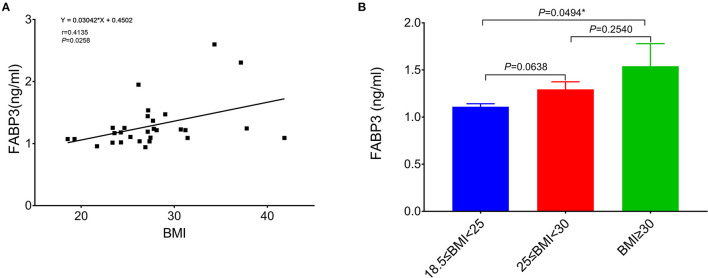
Figure 5.
The relation of BMI to FABP3 in the atrium. (A) The Pearson correlation analysis shows that the level of FABP3 in the atrium is significantly positively correlated with BMI. (B) Comparison of the level of FABP3 in the right atrium between the normal group (18.5 kg/m2 ≤ BMI < 25 kg/m2, n = 10), the overweight group (25 kg/m2 ≤ BMI < 30 kg/m2, n = 12), and the obese group (BMI ≥ 30 kg/m2, n = 7) and there is a significant difference of the level of FABP3 in the atrium between the normal group and the obese group. *Compared to the obese group, p < 0.05. Data are expressed as mean ± SEM. BMI, body mass index; FABP3, fatty acid binding protein 3.

