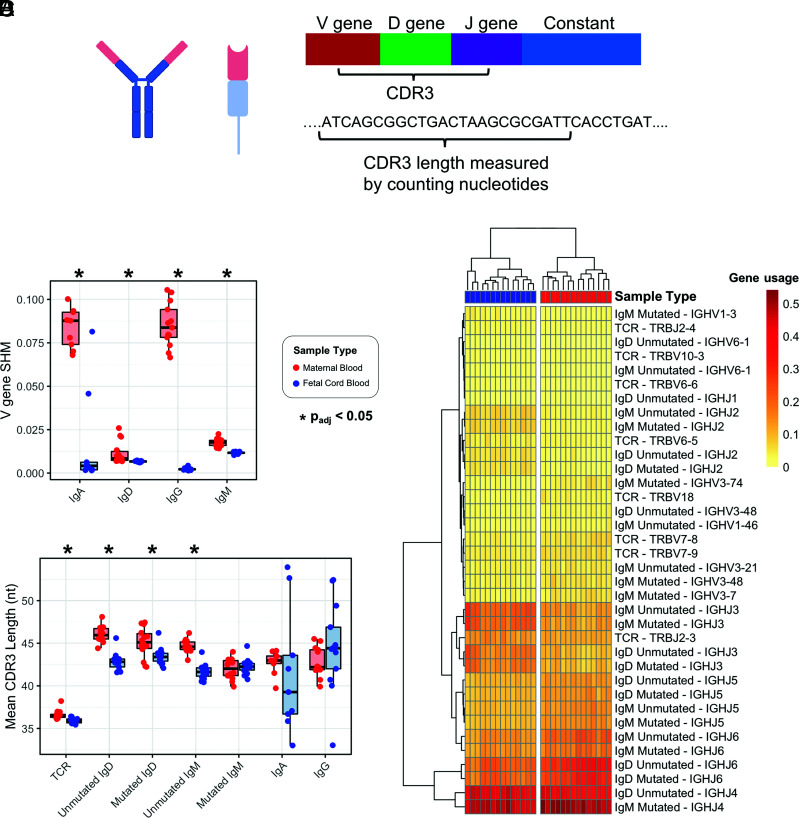
FIGURE 2.
Term maternal versus cord blood TCR-β and IgH comparison for SHM rates, CDR3 length, and gene usage. (A) Zoom-in of V region for TCR-β and IgH. (B) V gene SHM rate in maternal versus cord blood. (C) Mean CDR3 length in maternal versus cord blood. *Adjusted p value < 0.05 by Wilcoxon rank-sum test and adjusted for multiple comparisons using the Benjamini–Hochberg procedure. (D) Applying hierarchical clustering to the V and J genes with significantly different usage results in perfect separation of maternal blood and cord blood samples into two clusters.

