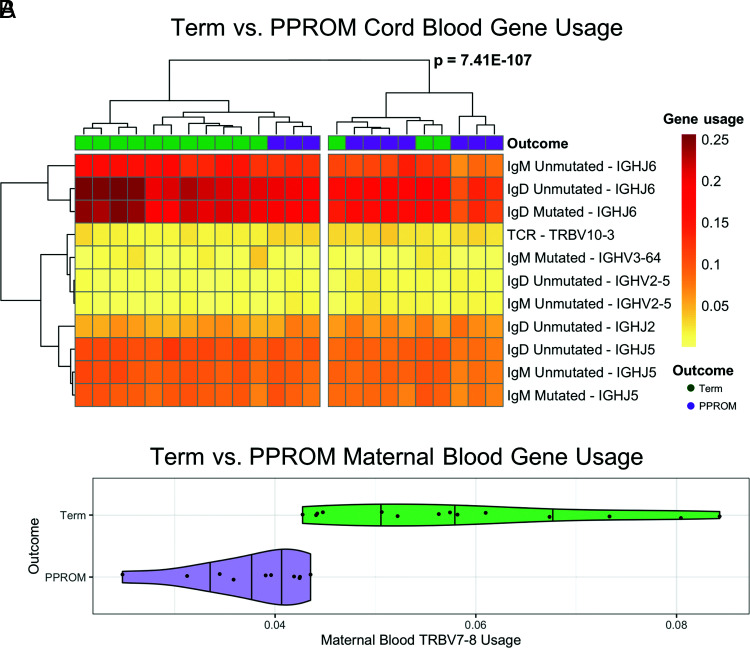
FIGURE 4.
TCR-β and IgH gene usage heat map of term versus PPROM groups. (A) For cord blood samples, hierarchical clustering of V genes and J genes with significantly different usage resulted in two sample clusters. (B) Violin plot (with overlaid scatterplot) of the usage of TRBV7-8 in maternal blood samples. The shape of the plot reflects the probability distribution, and the vertical bars denote the quartile boundaries (25, 50, and 75%).

