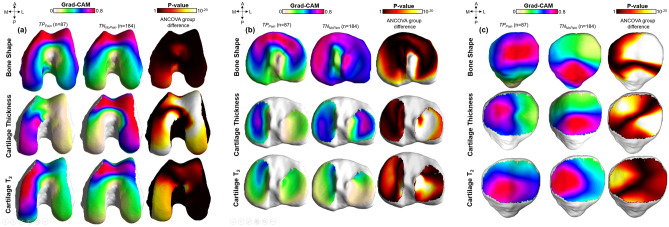
Figure 1.
The vertices of a reference bone surface, selected to match the average demographic distribution of the test set, were mapped on all the bone surfaces in the test set using a fully automatic landmark-matching algorithm. The maximum and minimum local curvatures were used for coupling homologous points on two surfaces. Both these features were locally defined on the surfaces and used to identify the landmark matching. After the landmark matching procedure, with the heat maps in the same reference space, localized group analysis was performed to compare the true positive (TPpain) and true negative (TNNopain) model predictions for each single biomarker. Local Statistical Parametric Mapping (SPM) was performed on these two groups to assess differences in location of important features significant for presence of pain (TPpain) or specific for absence of pain (TNNopain). Point-by-point SPM was performed using ANOVA group comparison considering age, sex and BMI as confounding factors.

