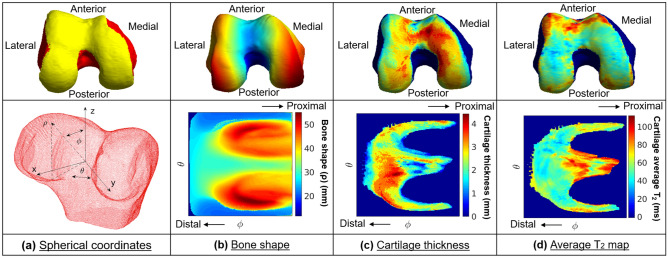
Figure 3.
Biomarker 2D spherical maps. The three biomarkers projected to the articular bone surface were converted to 2D spherical maps. (a) The transformation from Cartesian coordinates into spherical coordinates was performed by uniformly sampling 224 × 224 points in the point cloud and describing them based on the angle along the x–y plane from the positive x-axis (θ), the elevation angle from the x–y plane (φ) and the distance from the center of the point cloud to the sampled point in the surface (ρ). The angle θ was sampled from − π to + π for all bones while the angle φ was sampled from − π/2 to + π/8 for the femur and tibia and from − π/2 to + π/8 for the patella. The sampling was designed to be centered around the articular surface to ensure the cartilage would be centered for each bone. (b) Bone shape 2D spherical map. (c) Cartilage thickness 2D spherical map. (d) Cartilage average T2 value 2D spherical map.

