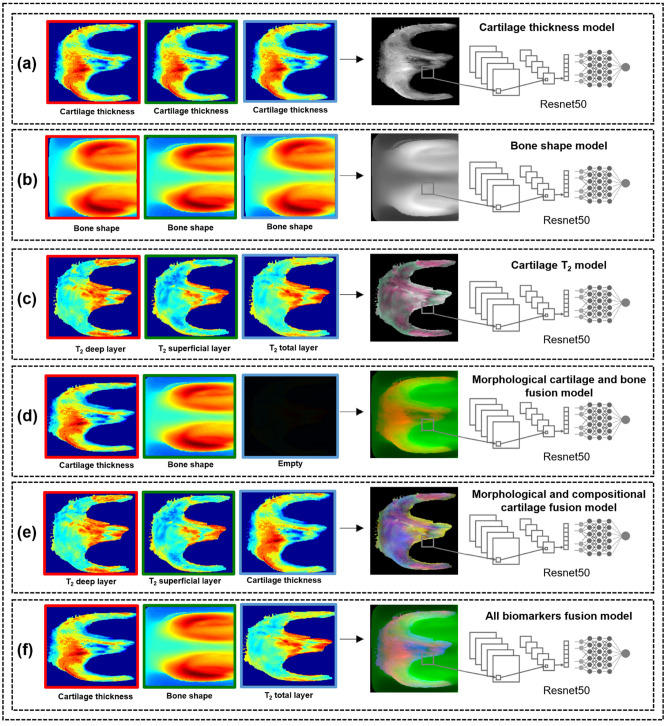
Figure 4.
Overview of the biomarker model strategies, shown for the femur. The normalized spherical images for each patient were merged into a three-channel 8-bit image. (a–c) The first three strategies consisted of the single biomarkers: cartilage thickness, bone shape, and cartilage T2. (a) The cartilage thickness strategy consisted of the cartilage thickness spherical maps replicated three times into a spherical image. (b) The bone shape strategy consisted of the bone shape spherical maps replicated three times into a spherical image. (c) The cartilage T2 strategy consisted of the deep, superficial, and average T2 spherical maps as the first, second, and third channels respectively. (d–f) The last three fusion strategies consisted of the biomarker fusions: morphological cartilage and bone fusion, morphological and compositional cartilage fusion and all biomarkers fusion. (d) The morphological cartilage and bone fusion consisted of the cartilage thickness and bone shape spherical maps as the first and second channels respectively, with the last channel empty. (e) The morphological and compositional cartilage fusion consisted of the deep and superficial T2 spherical maps as the first and second channels respectively with the third channel consisting of the cartilage thickness spherical map. (f) The all biomarkers fusion consisted of the cartilage thickness, bone shape, and average T2 spherical map as the first, second and third channels respectively.

