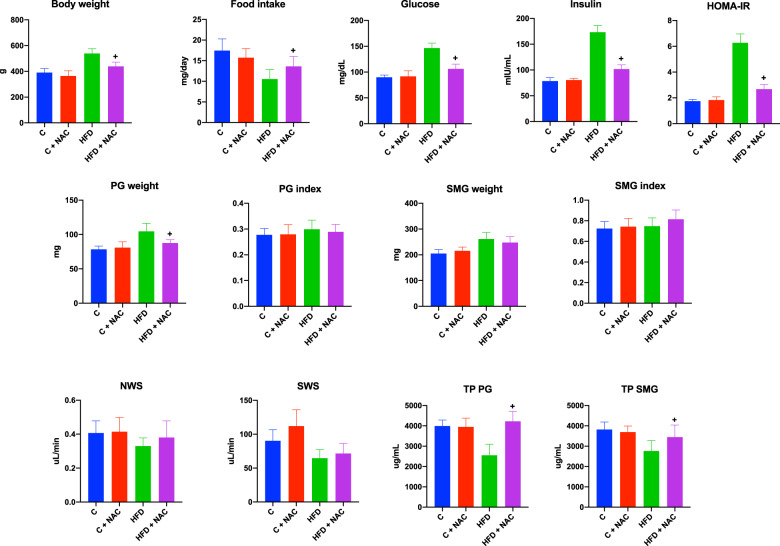
Fig. 1. General characteristics of rats and salivary gland function.
ap < 0.05 vs. C, bp < 0.05 vs. HFD. C control group, C + NAC control rats + NAC administration, HFD high-fat-fed group, HFD + NAC high-fat-fed rats + NAC administration, HOMA-IR homeostasis model assessment of insulin resistance, NWS non-stimulated whole salivary flow PG parotid salivary glands, SMG submandibular salivary glands, SWS stimulated whole salivary flow, TP total salivary proteins.

