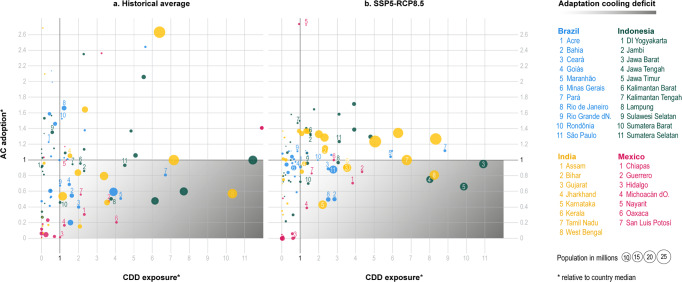
Fig. 4. Adaptation cooling deficit.
Current situation (a, latest wave available) and future projections in 2040 with RCP8.5 warming and SSP5 (b) computed with Cooling Degree Days (CDDs). Bubble size proportional to the current number of households relative to each country’s maximum. For the historical period, the following waves are used: Brazil, 2018 India, 2012, Indonesia, 2017, Mexico, 2016. Colors are used to differentiate the four countries. See http://www.energy-a.eu/cooling-deficit/ for the interactive online version.

