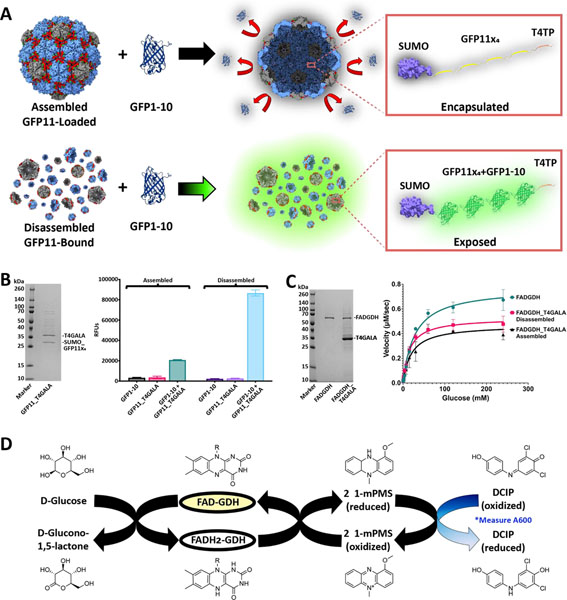
Figure 4.
In vivo cargo loading of T4GALA and characterization of cargo-loaded systems. A) Schematic of split fluorescent protein experiments. Assembled (top) and disassembled (bottom) GFP11×4-loaded/bound T4GALA exposed to the GFP1–10 complement. B) SDS-PAGE analysis of GFP11×4-loaded T4GALA (left). Plate-based fluorescence assays (right) showing increased relative fluorescence for disassembled GFP11×4-bound T4GALA complementation (light blue; right) compared to roughly four-fold lower fluorescence for an equimolar amount of assembled GFP11×4-loaded T4GALA (green, left). C) SDS-PAGE analysis of GDH and GDH-loaded T4GALA (left). Non-linear regression curve with Michaelis-Menten fit of velocity (right) of unencapsulated FAD-dependent glucose dehydrogenase enzyme (green circles), in vivo T4GALA-encapsulated enzyme in the disassembled state (pink squares), and in vivo T4GALA-encapsulated enzyme in the assembled state (black triangles) with varying concentrations of glucose (two-fold dilutions from 240 mM to 0.94 mM) at a fixed concentration of DCIP (0.07 mM) demonstrating GDH activity. Data are shown as means while error bars represent standard deviations from three independent experiments. D) Schematic summary of the catalyzed enzymatic reaction and the complementary assay measuring the resultant decrease in absorption at 600 nm as DCIP is reduced. FAD, flavin adenine dinucleotide; GDH, glucose dehydrogenase; 1-mPMS, 1-methoxy-5-methylphenazinium methylsulfate; DCIP, 2,6-dichloroindophenol.

