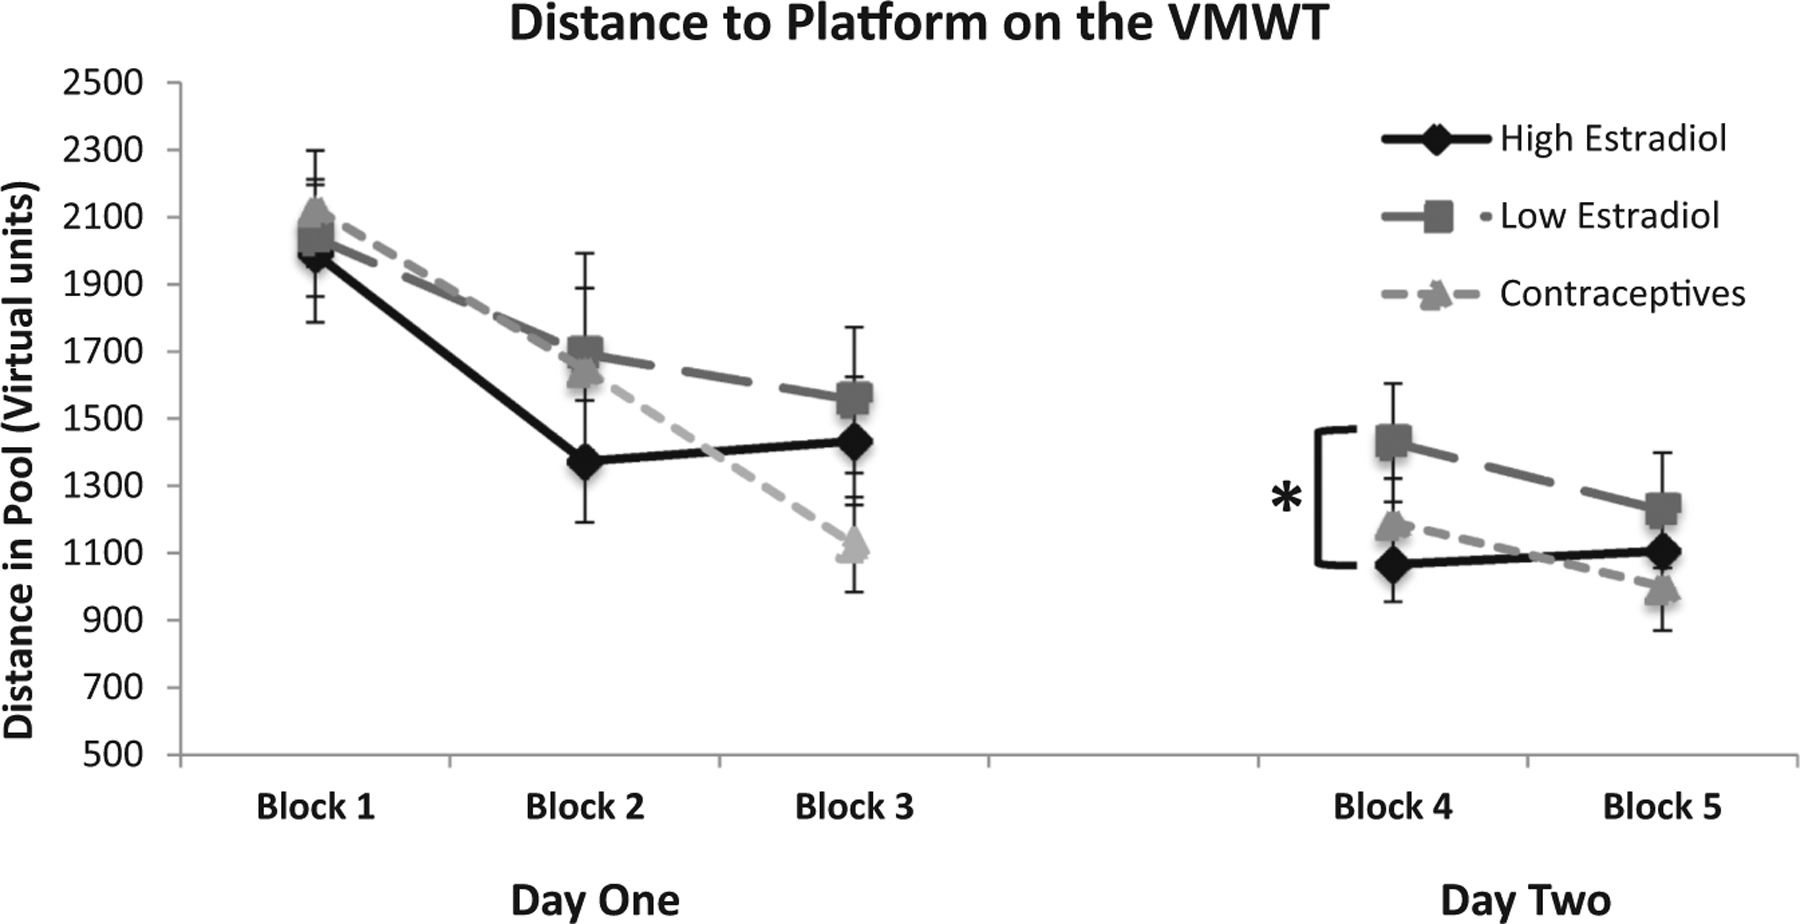
Fig. 2.

Mean distance to platform on the virtual Morris water task across days. Shorter distances indicate more direct paths (better performance). Error bars indicate standard error of the mean (SEM). In Block 4, the high estradiol group exhibited significantly shorter distances to the platform than the low estradiol group (p = 0.01). The high estradiol and contraceptive groups did not differ on any blocks across days.
