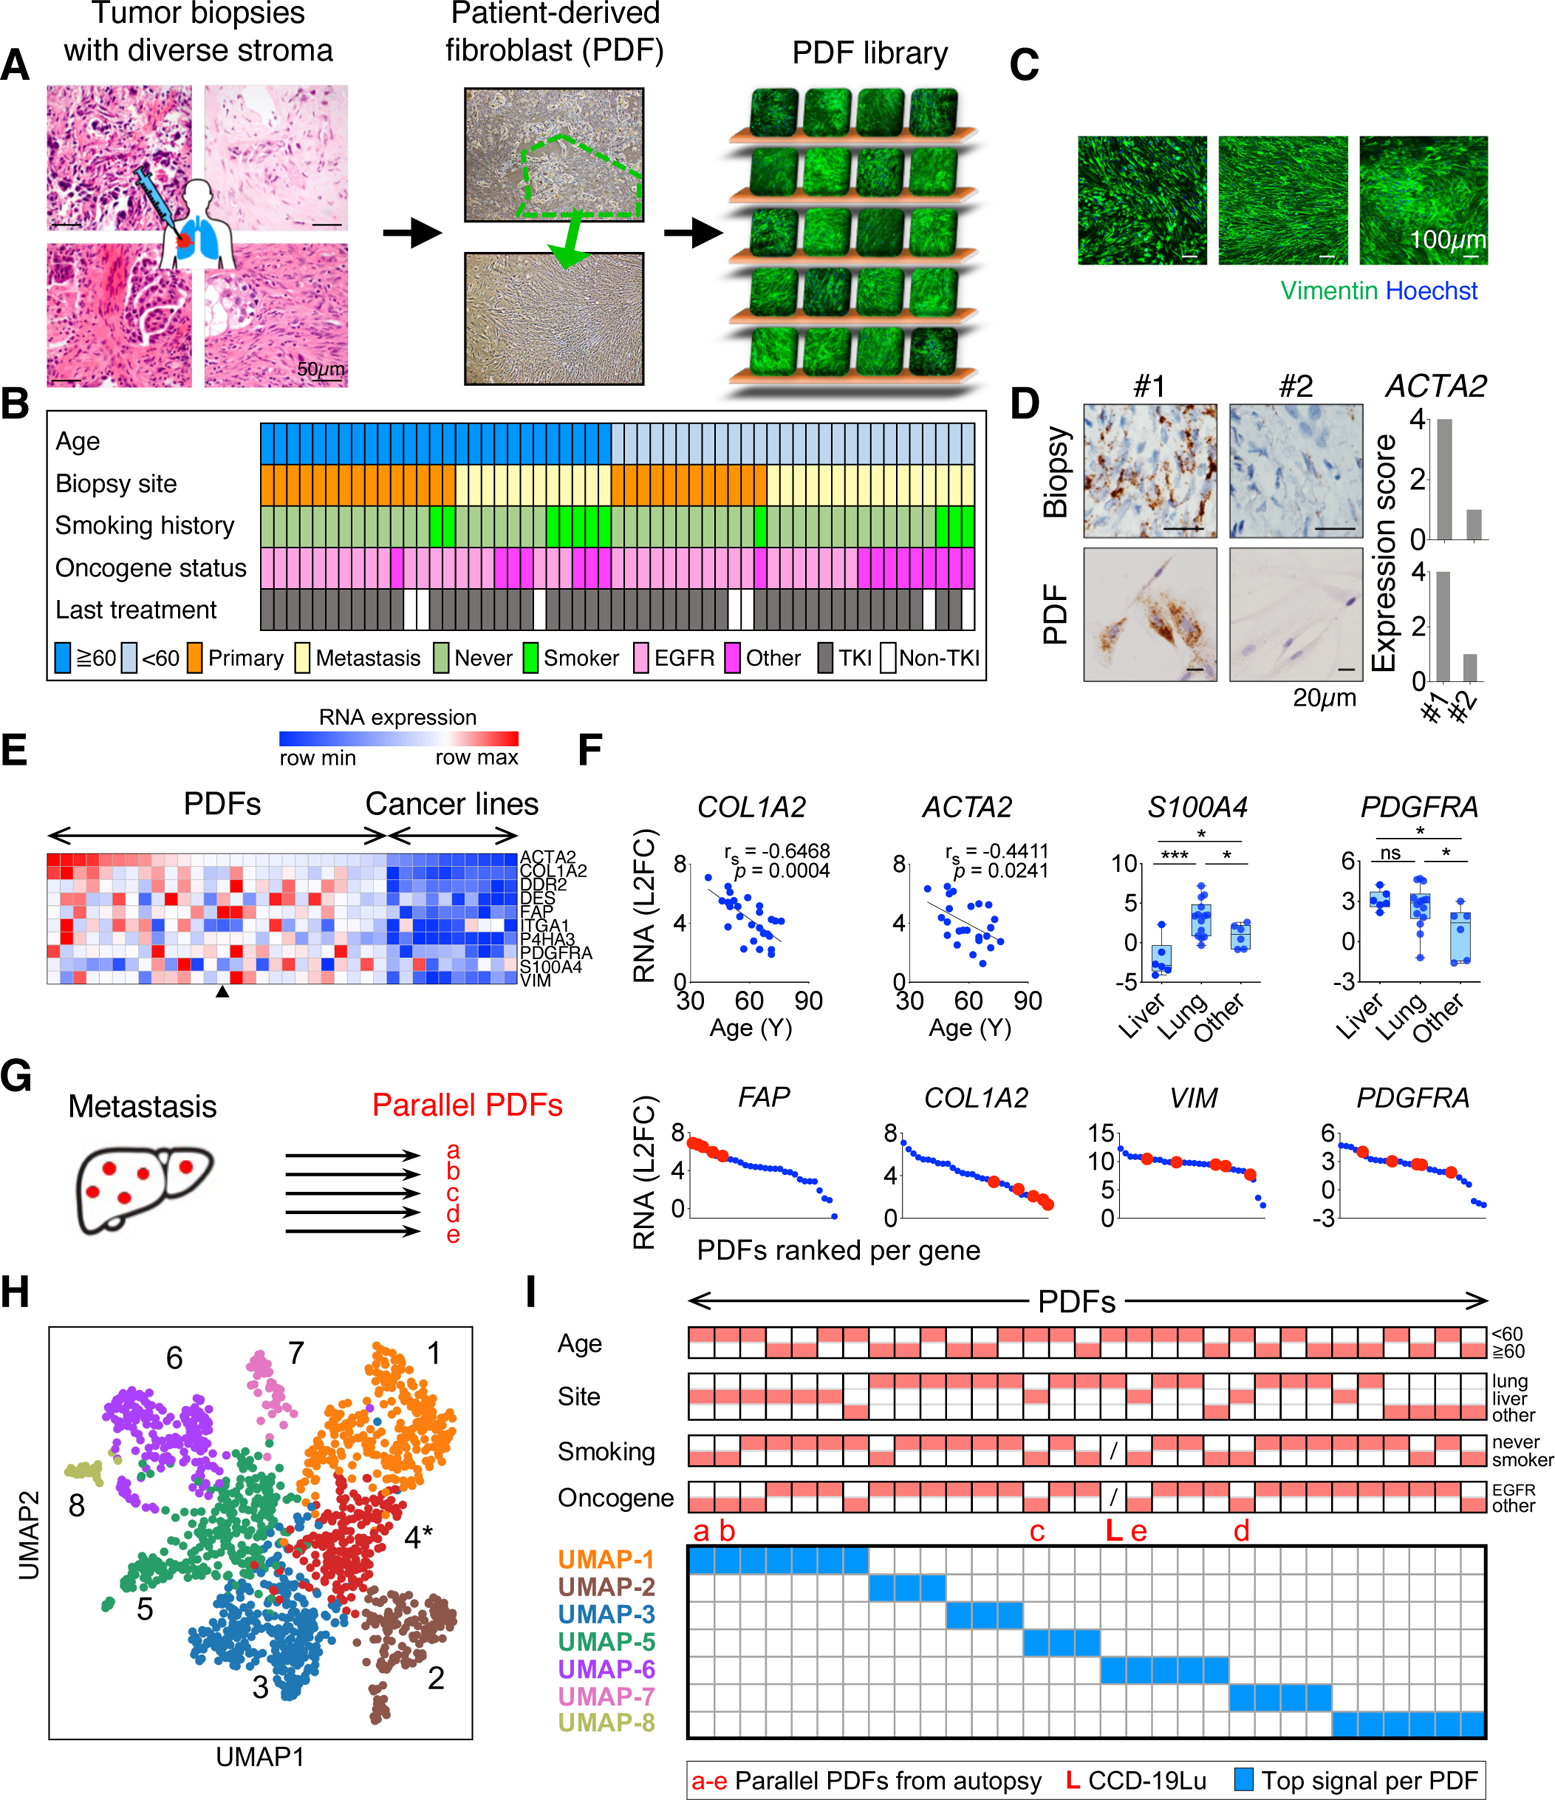
Figure 1: Establishment of a living biobank adequately capturing NSCLC CAFs heterogeneity.

A. Workflow of patient-derived fibroblast (PDF) development. PDF library is symbolized with different PDFs (staining of Vimentin) on the shelf. B. Clinical features of patients whose tumors were used for developing PDFs. C. Images from immunofluorescence staining of Vimentin and Hoechst of representative PDFs. D. Images and quantification of αSMA (encoded by ACTA2) mRNA in two EGFR+ lung cancer samples and their corresponding PDFs detected by using RNAscope. E. mRNA levels of canonical CAF markers in PDFs and in lung cancer cell lines measured by qRT-PCR. The arrowhead indicates the average expression level of the five PDFs in (G). F. Correlations between the mRNA level of COL1A2 or ACTA2 and patients’ age at the time of biopsy across PDFs (left two graphs) and the mRNA level of S100A4 or PDGFRA according to the site of tumor biopsy. * p < 0.05, *** p < 0.001, Spearman’s r and two-tailed t-test are used. G. Expression of indicated CAF markers (red) in PDFs established from liver metastases in an autopsy case. H. Uniform Manifold Approximation and Projection (UMAP) analysis of 1,465 single fibroblasts in NSCLC (from Lambrechts et al., 2018) showing seven molecular classes, excluding UMAP-4 (*) due to poor quality cells. I. PDFs are mapped based on their top UMAP signal. Red blocks on the top indicate clinical features of the corresponding PDFs. See also Figures S1-S3 and Table S1.
