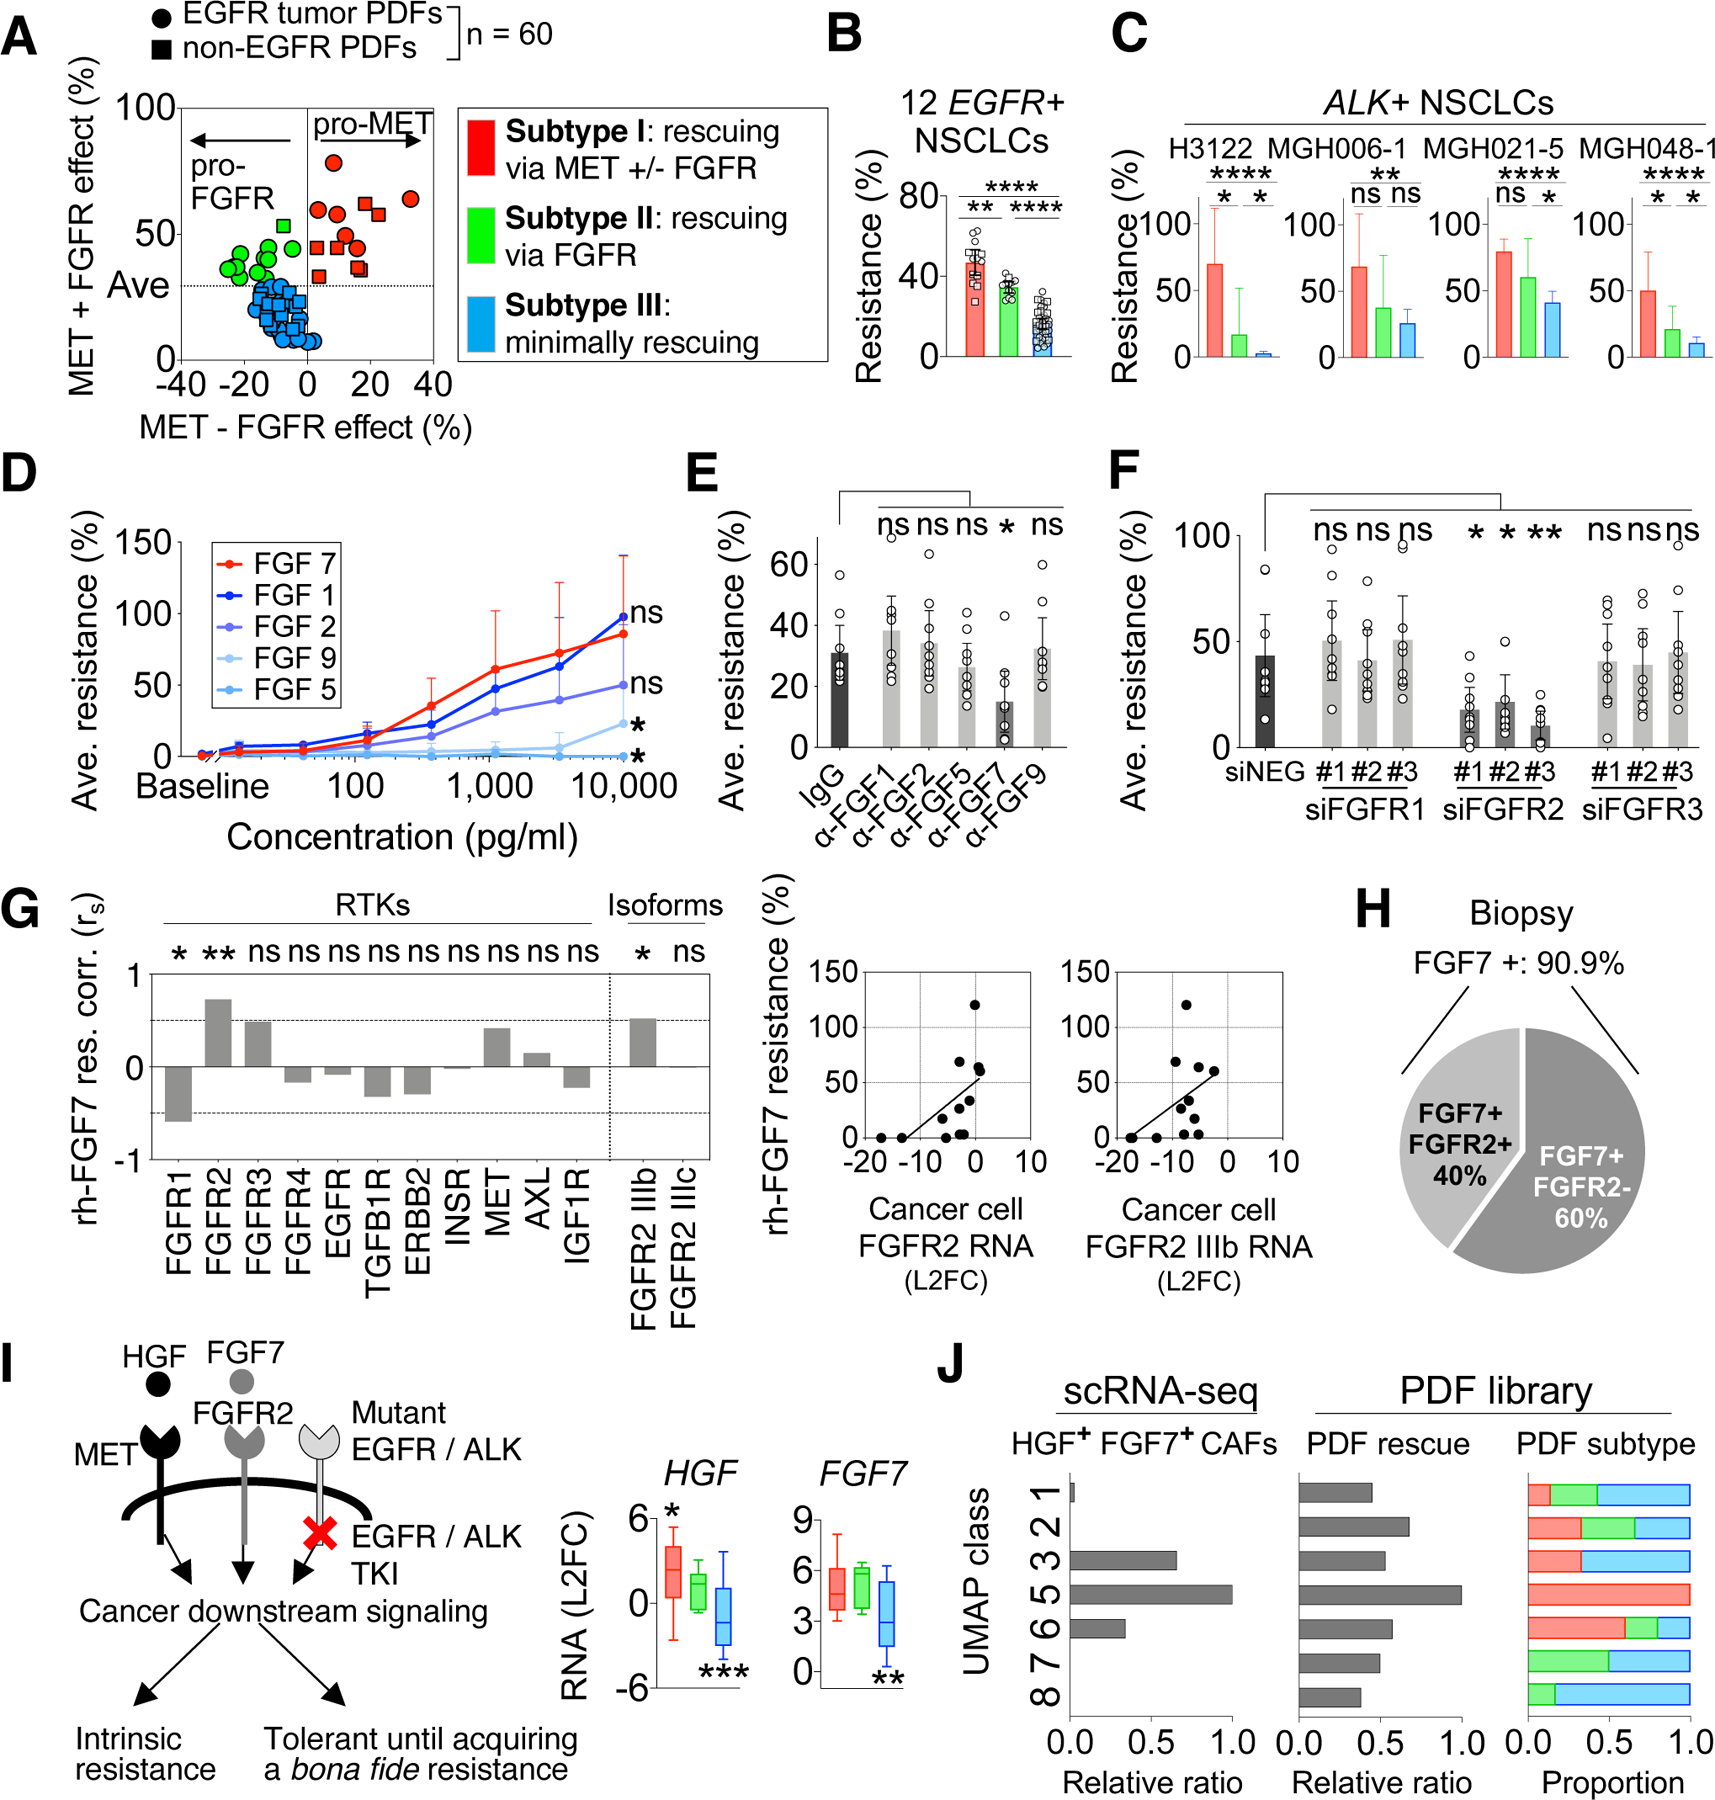
Figure 5: Expression of HGF and FGF7 define three subtypes of CAFs marked with distinct therapeutic strategies.

A. Sixty PDFs (dots) are classified according to their rescue effect mediated by MET and FGFR: MET-predominant rescue (red), FGFR-predominant rescue (green), and minimum rescue (blue). “MET – FGFR effect” (x-axis) is calculated by MET effect (resistance to EGFRi+FGFRi) minus FGFR effect (resistance to EGFRi+METi). “MET+FGFR effect” (y-axis) is calculated by MET effect plus FGFR effect. B. The overall EGFRi resistance (plain effect against EGFRi) conferred by PDFs is then plotted based on the functional subtypes defined in (A). (A-B), Effect of each PDF (dot) is tested across 12 EGFR+ NSCLC cancers. C. The rescue level of 19 PDFs on ALK+ NSCLC cell lines against ALKi. Results are shown by PDFs’ functional subtypes defined in (A). D. The average effect of indicated recombinant FGF on resistance to EGFRi across 5 cancer cell lines. E. The effect of neutralizing indicated FGF in PDF conditioned media on diminishing cancer cells’ resistance to EGFRi plus METi (HGF-independent resistance). F. The effect of knockdown FGFR1, FGFR2 and FGFR3 in cancer cells on diminishing cancer cells’ resistance to EGFRi plus METi in the presence of PDF conditioned media. (E-F), Effect of each PDFs (dots, n = 9) is tested across 5 cancer models. (B-F), Mean with 95% CI are shown. G. Correlations between cancer cells’ expression of indicated receptors and their resistance level conferred by recombinant FGF7 (10ng/mL). Two-tailed Spearman’s r is used. H. Prevalence of FGF7 and FGFR2 expression in EGFR+ NSCLC biopsies (n=11). I. Schematics showing that HGF and FGF7 mediate the bypass activation of cancer downstream signaling and resistance (left). HGF and FGF7 RNA levels are assessed in PDFs based on their functional subtypes by qRT-PCR (right). Whiskers are maximum and minimum values, two-tailed t test based on single group compared to all other PDFs. J. Comparison between CAF molecular classes defined by scRNA-seq analysis and CAF functional subtypes revealed by PDF analysis. The PDFs’ functional profiles are plotted by the UMAP classes (right). * p < 0.05, ** p < 0.01, *** p < 0.001, **** p < 0.0001, two-tailed t test. See also Figures S6.
