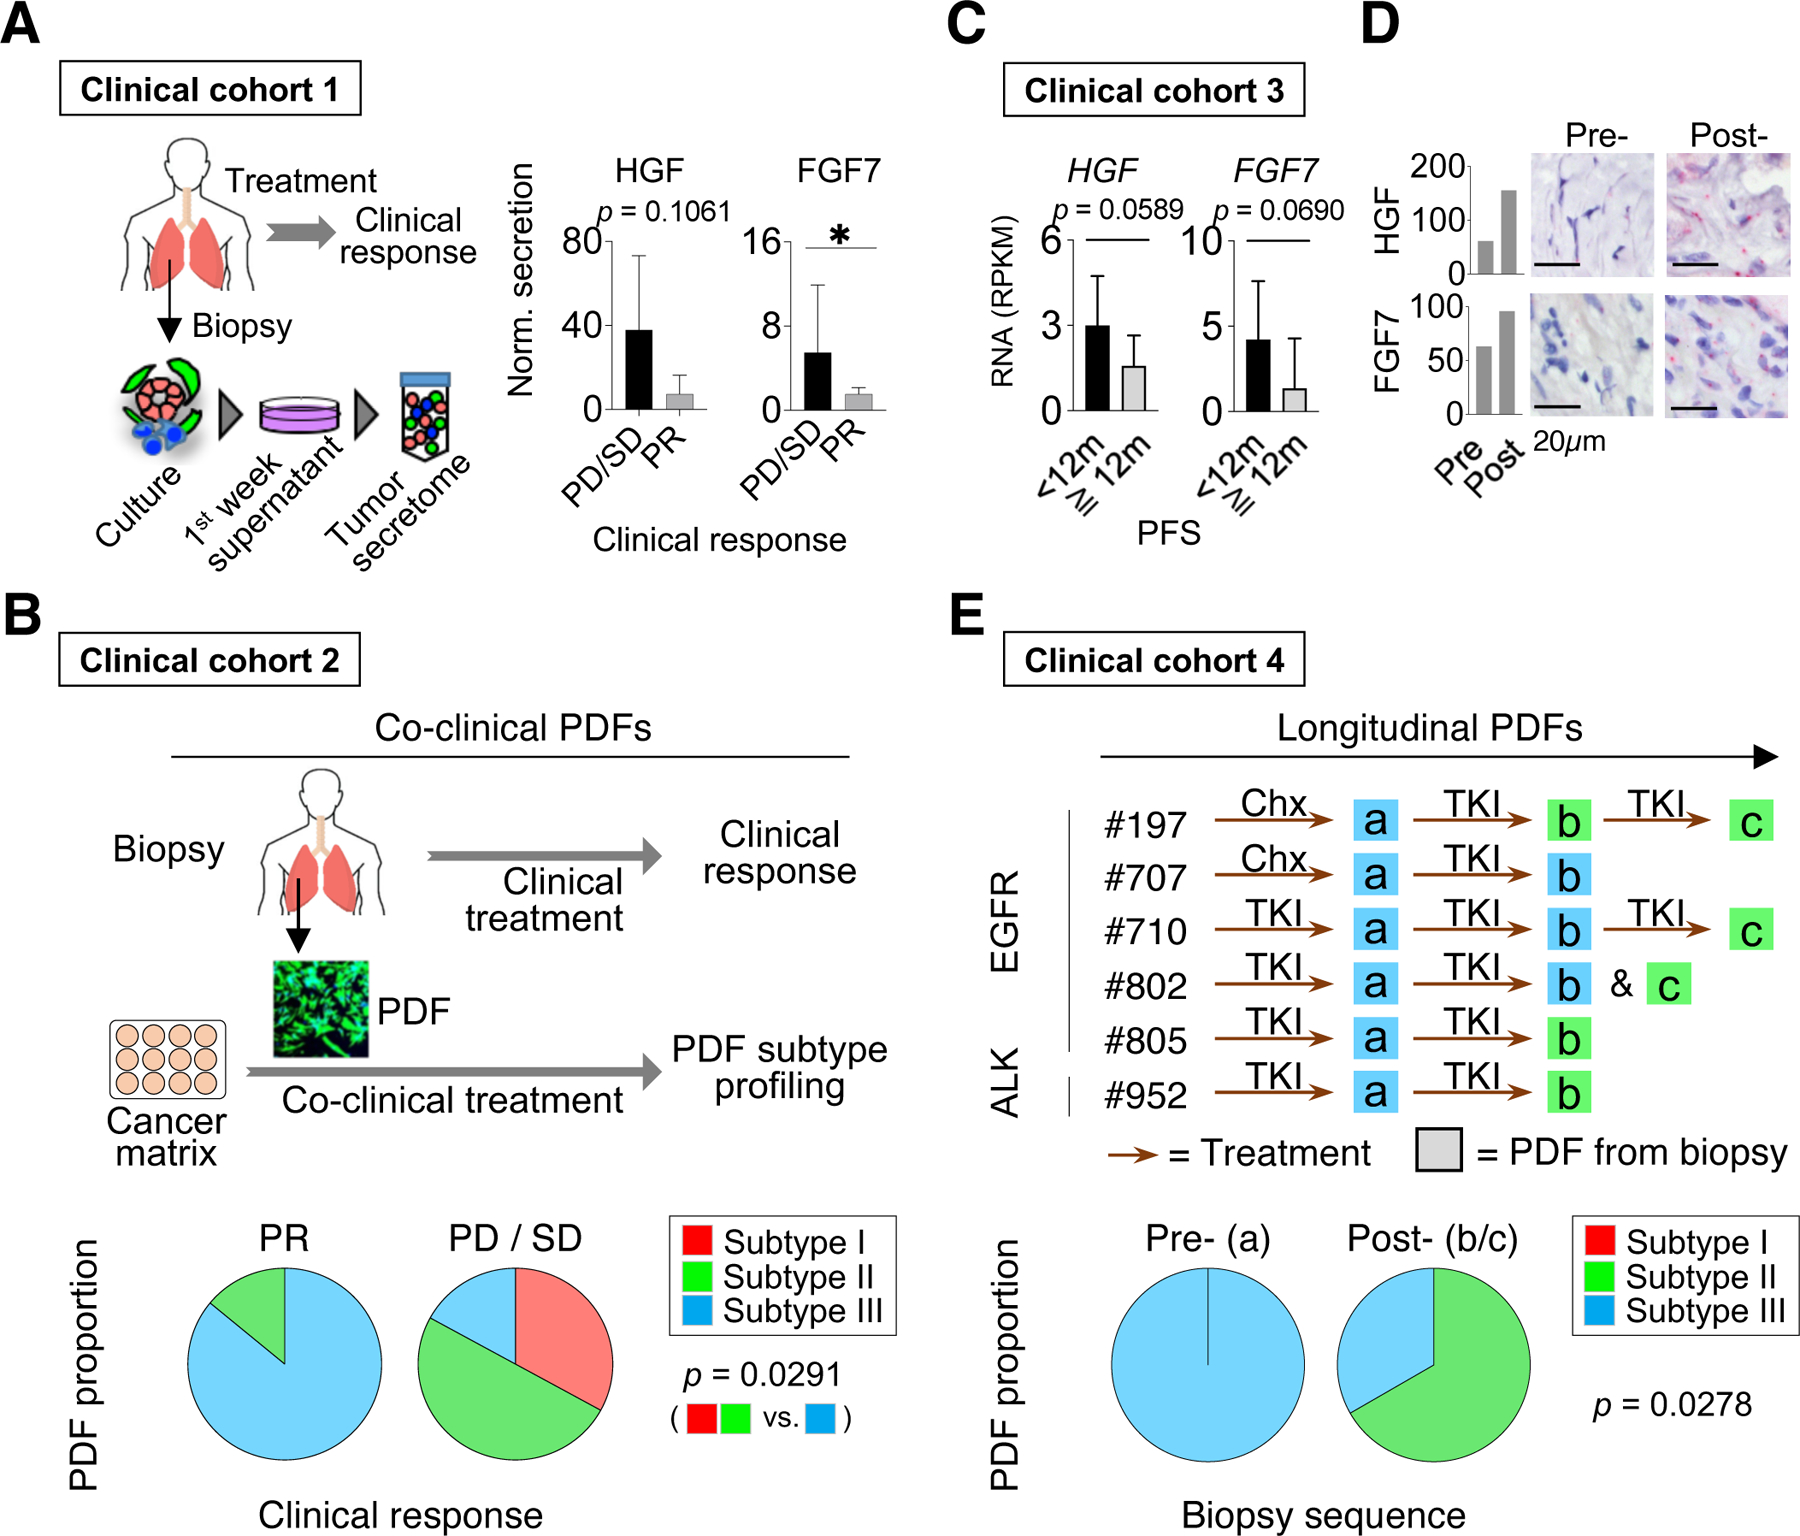
Figure 7: CAFs functional classification correlates with patients’ clinical outcome.

A. Normalized FGF7 and HGF secretion in 12 tumor secretome samples derived from EGFR+ NSCLC biopsies before the covalent EGFR TKI (osimertinib or equivalent) treatment. Results are compared based on patients’ clinical response, progressive disease (PD)/stable disease (SD) vs. partial response (PR). Average with 95% CI are shown, one-tailed Mann-Whitney U test. B. The functional subtypes of PDFs established from 13 NSCLC patients before receiving a covalent EGFR TKI treatment (osimertinib or equivalent) are plotted against patients’ response to their treatment. C. RNAseq data of pre-osimertinib biopsies from 11 EGFR+ NSCLC patients (from Roper et al., 2020). The HGF and FGF7 RNA levels are shown based on patients’ progression-free survival (PFS) on the treatment. Average and 95% CI are shown, one-tailed t-test. D. RNA expression of HGF and FGF7 are stained by RNAscope in pre- and post-treatment biopsy samples from two patients. E. The functional heterogeneity in a collection of PDFs established from longitudinal biopsies from same patients. PDFs are colored by functional subtypes. Bottom: the proportion of PDF subtypes according to early (a) and later biopsies (b/c). (B and E), two-tailed Fisher’s exact test is used. See also Figures S7 and Table S5.
