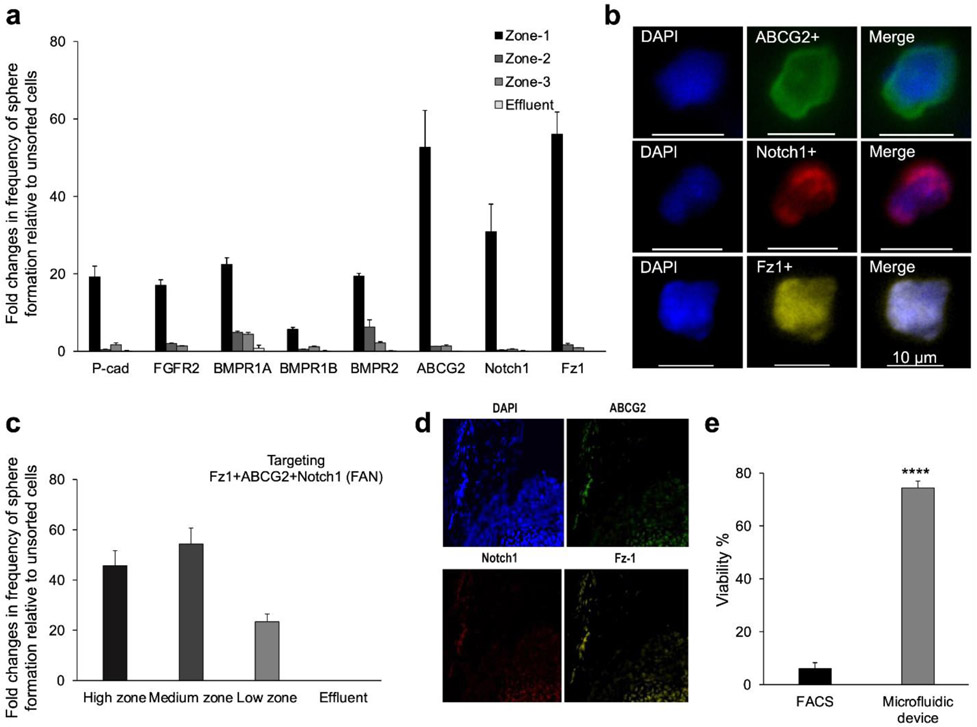
Figure 2.
Isolation and characterization of RSCs. (a) Preliminary screen of candidate antibodies using the magnetic resolution approach. Frequency of clonal sphere formation represents the ratio of formed spheres to the total number of isolated live cells normalized to unsorted cells. (b) Fluorescence images of single cells isolated in the device and immunostained with FITC-labeled ABCG2, Cy5-labeled Notch1, and AF594-labeled Fz1 antibodies. (c) Dissociated CE cells incubated with MNPs-labeled antibodies specific to Fz1, ABCG2, and Notch1 (FAN), exhibited the highest capture efficiency of RSCs. (d) Immunostaining of the CE in mouse eyes with ABCG2, Notch1 and Fz1 antibodies. (e) Percentage of viable cells sorted using the microfluidic device benchmarked against FACS. *** p<0.005 (Student’s t-test).

