Figure 3.
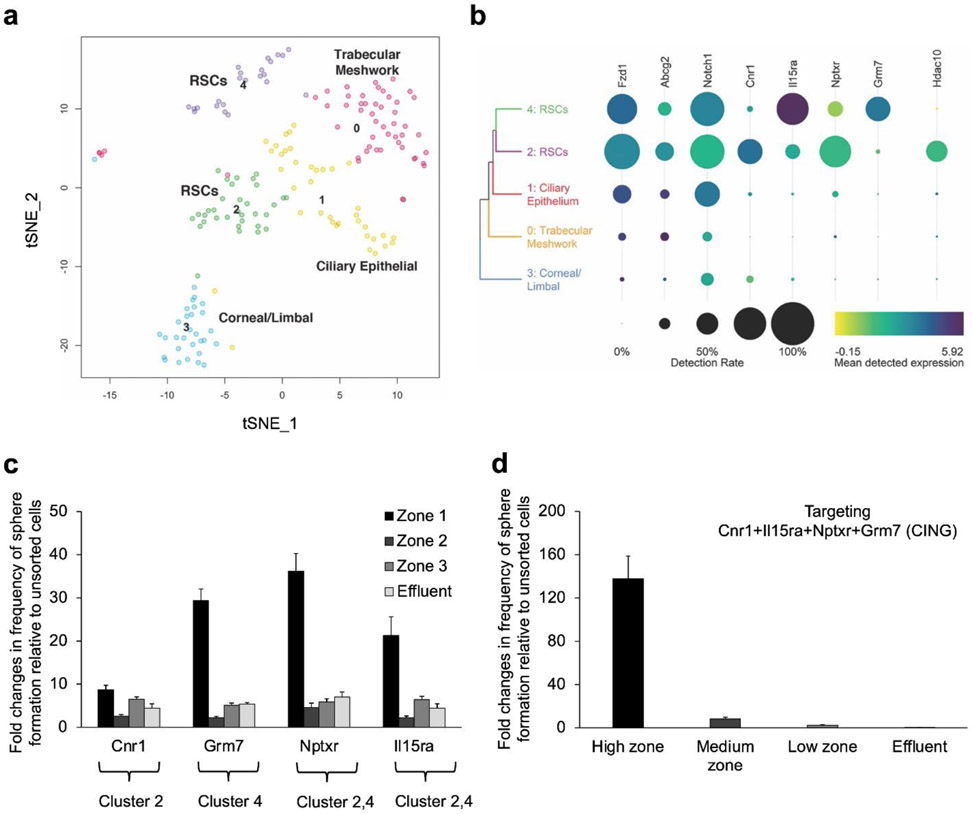
SMART deep sequencing analyses of sorted FAN+ mouse CE cells. Single FAN+ cells sorted using the microfluidic device were sequenced using SMART-seq v4 after a cohort of cells were tested for sphere-forming ability (1:2 enrichment of RSCs). A total of 177 usable cells were analyzed. (a) t-SNE plot identifying 5 clusters. Uniquely DE genes from each cluster were used to annotate them as trabecular meshwork cells (0), ciliary epithelial cells (1), corneal/limbal cells (3), and retinal stem cells in both clusters 2 and 4, confirmed by RSC sphere-forming ability. (b) Heat map showing the cell-surface markers used to isolate the RSCs, the new cell-surface markers and transcription factors that are DE in each RSC cluster. Dot size indicates the proportion of cells in each cluster, while the colour shows mean normalized gene expression in the cells in which the gene was detected. (c) Cell sorting using antibodies specific to the identified cell-surface markers. The cells isolated from each capture zone were plated at clonal density (10 cells/μL) for sphere-forming assays. (d) CE cells were incubated with a combination of antibodies specific to the identified cell-surface markers, sorted using the microfluidic device and plated at clonal density. Error bars = s.e.m., N=3 for each.

