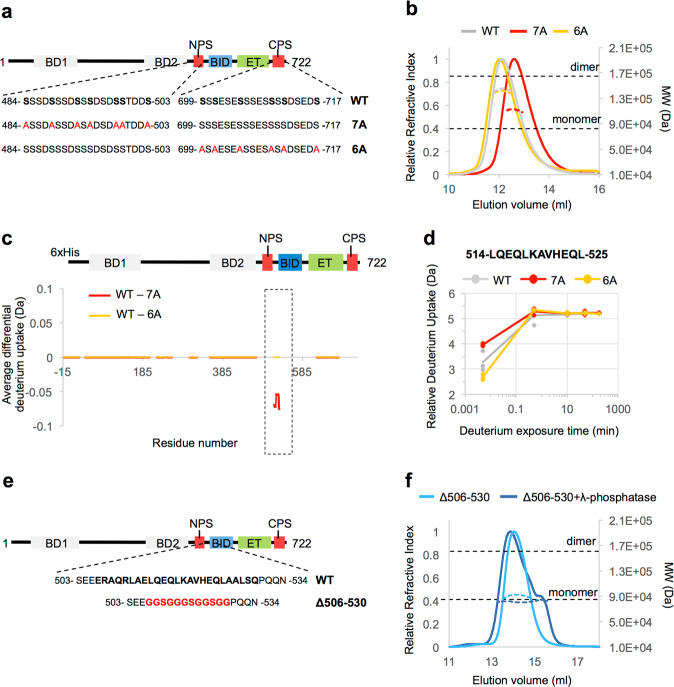
Fig. 4. Biophysical analysis of the regions and the phosphorylation sites required for BRD4 dimerization.
a Schematic overview of the BRD41–722 phospho-deficient mutants 7A and 6A. In the wild-type (WT) sequence of NPS and CPS, the CK2 consensus sites are highlighted in bold. In the 7A and 6A mutant sequences, the serine residues mutated to alanine are highlighted in red. b SEC-MALS elution profiles for the BRD41–722 constructs, produced in E. coli and phosphorylated by CK2. The grey line indicates WT, red line indicates the 7A mutant, and yellow line the 6A mutant. The dotted lines at each peak, colored as above, indicate the experimentally calculated MW. The dotted horizontal black lines represents the theoretical MW of the monomer or dimer of BRD41–722, calculated from the wild-type primary sequence. c Difference of deuterium uptake for each residue between the WT and the 7A (in red) or 6A (in yellow) mutants. All samples have been produced in bacteria and phosphorylated by CK2. A negative differential uptake indicates a lower deuterium uptake (more protected region) in the wild-type sample. Only peptides with changes above 0.5 Da and greater than 2.3x SD were taken into account. The increased exposure of motif B in the 7A mutant is highlighted with a rectangle with dotted line. Areas with no coverage are represented as gaps. For details on the calculation, see the Materials and Methods section. d Example of the relative deuterium uptake of a peptide within motif B. The uptake is substantially reduced in the shortest exposure time (3 sec on ice) in the phosphorylated BRD41–722 7A mutant compared to the phosphorylated wild type. The relative deuterium uptake (Da) over deuterium exposure time is reported for each n = 3 independent experiments. Grey circles and line indicates WT, red circle and line 7A mutant, yellow circle and line 6A mutant. e Schematic representation of the BRD41–722 ∆506-530 produced in insect cells. In the wild-type (WT) sequence, the region spanning residues 506–530 is in bold. In the ∆506–530 mutant sequence, the 12-residue glycine-serine-rich flexible linker used to replace the 506-530 aa sequence is highlighted in red. f SEC–MALS elution profiles of the BRD41–722 ∆506–530 produced in insect cells and treated (blue line) or not treated (light blue line) with λ-phosphatase. The dotted line at each peak, colored as above, indicates the experimentally calculated MW. The dotted horizontal lines represent the theoretical MW of the monomer or dimer of BRD41-722∆506–530.

