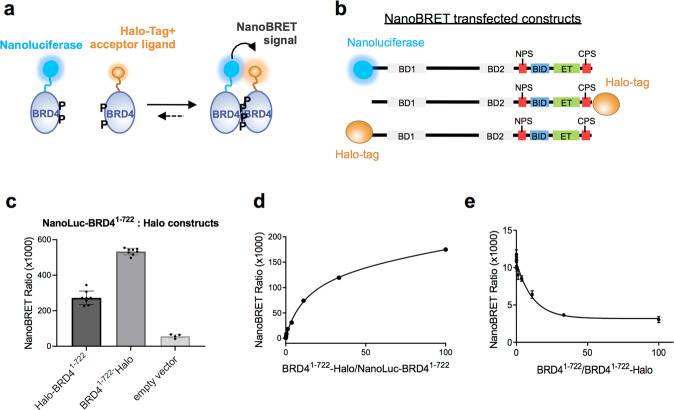
Fig. 5. NanoBRET analysis of BRD4 dimerization in cells.
a Schematic summary of the NanoBRET assays to test BRD4 homo-dimerization in HCT116 cells. The curved black arrow represents Bioluminescence Resonance Energy Transfer (BRET) between the Nanoluciferase donor (blue circle) and the Halo-tag acceptor ligand (orange circle). b Overview of the NanoBRET transfected constructs used in the NanoBRET experiments, with BRD41–722 tagged at the N-terminus with Nanoluciferase, and at the N-terminus or at the C-terminus with Halo-tag. c NanoBRET signal observed using NanoLuc-BRD41–722 and Halo-BRD41–722 (dark grey bar) or NanoLuc-BRD41–722 and BRD41–722-Halo (grey bar). The single measurements and the mean with SD are reported (n = 8 for samples and n = 4 for control independent experiments). d Titration NanoBRET experiments where increasing amounts of acceptor DNA (BRD41–722-Halo) were transfected with a fixed amount of donor DNA (NanoLuc-BRD41–722). The mean with the standard error of the mean (SEM) is reported (n = 4 independent experiments) e Competition NanoBRET experiments where increasing amount of untagged BRD41–722 DNA were transfected with a fixed amount of donor and acceptor DNA pair (NanoLuc-BRD41–722 and BRD41–722-Halo). The reduction of the NanoBRET signal at increasing values of untagged/Halo-tagged BRD41–722 ratio indicates a specific competition of the untagged protein towards BRD41–722-Halo for binding to NanoLuc-BRD41–722. The mean with SEM is reported (n = 4 independent experiments).

