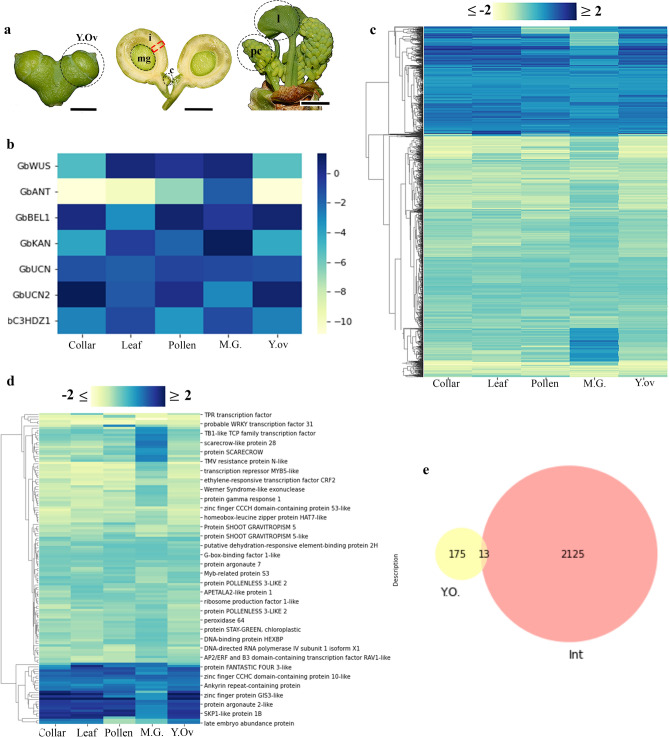
Figure 5.
Transcriptome results focused on integument development. (a) Ginkgo samples that were sequenced separately to perform the differential expression analyses. Red square indicates the integument. (b) Heatmap of the genes from the integument developmental network differentially expressed in the integument. (c) Cluster map throughout all the tissues compared to the integument, 2137 Differentially Expressed (DE) genes with a fold expression change between − 2 and 2 and good transcriptional support (TPM ≥ 0.95). Each column of the cluster map indicated the twofold changes of each sample with respect to the integument. (d) 134 DE transcription factors differentially expressed in the integument compared to all the other samples. Two clusters were identified that largely consisted of up-regulated (blue clusters, n = 21) and down-regulated genes (yellow, n = 97). (e) Comparison of the DE genes between the young ovule sample and the integument. (f) Comparison of the DE genes between the megagametophyte and the integument. Blue, upregulated genes and yellow, downregulated genes (b–d).

