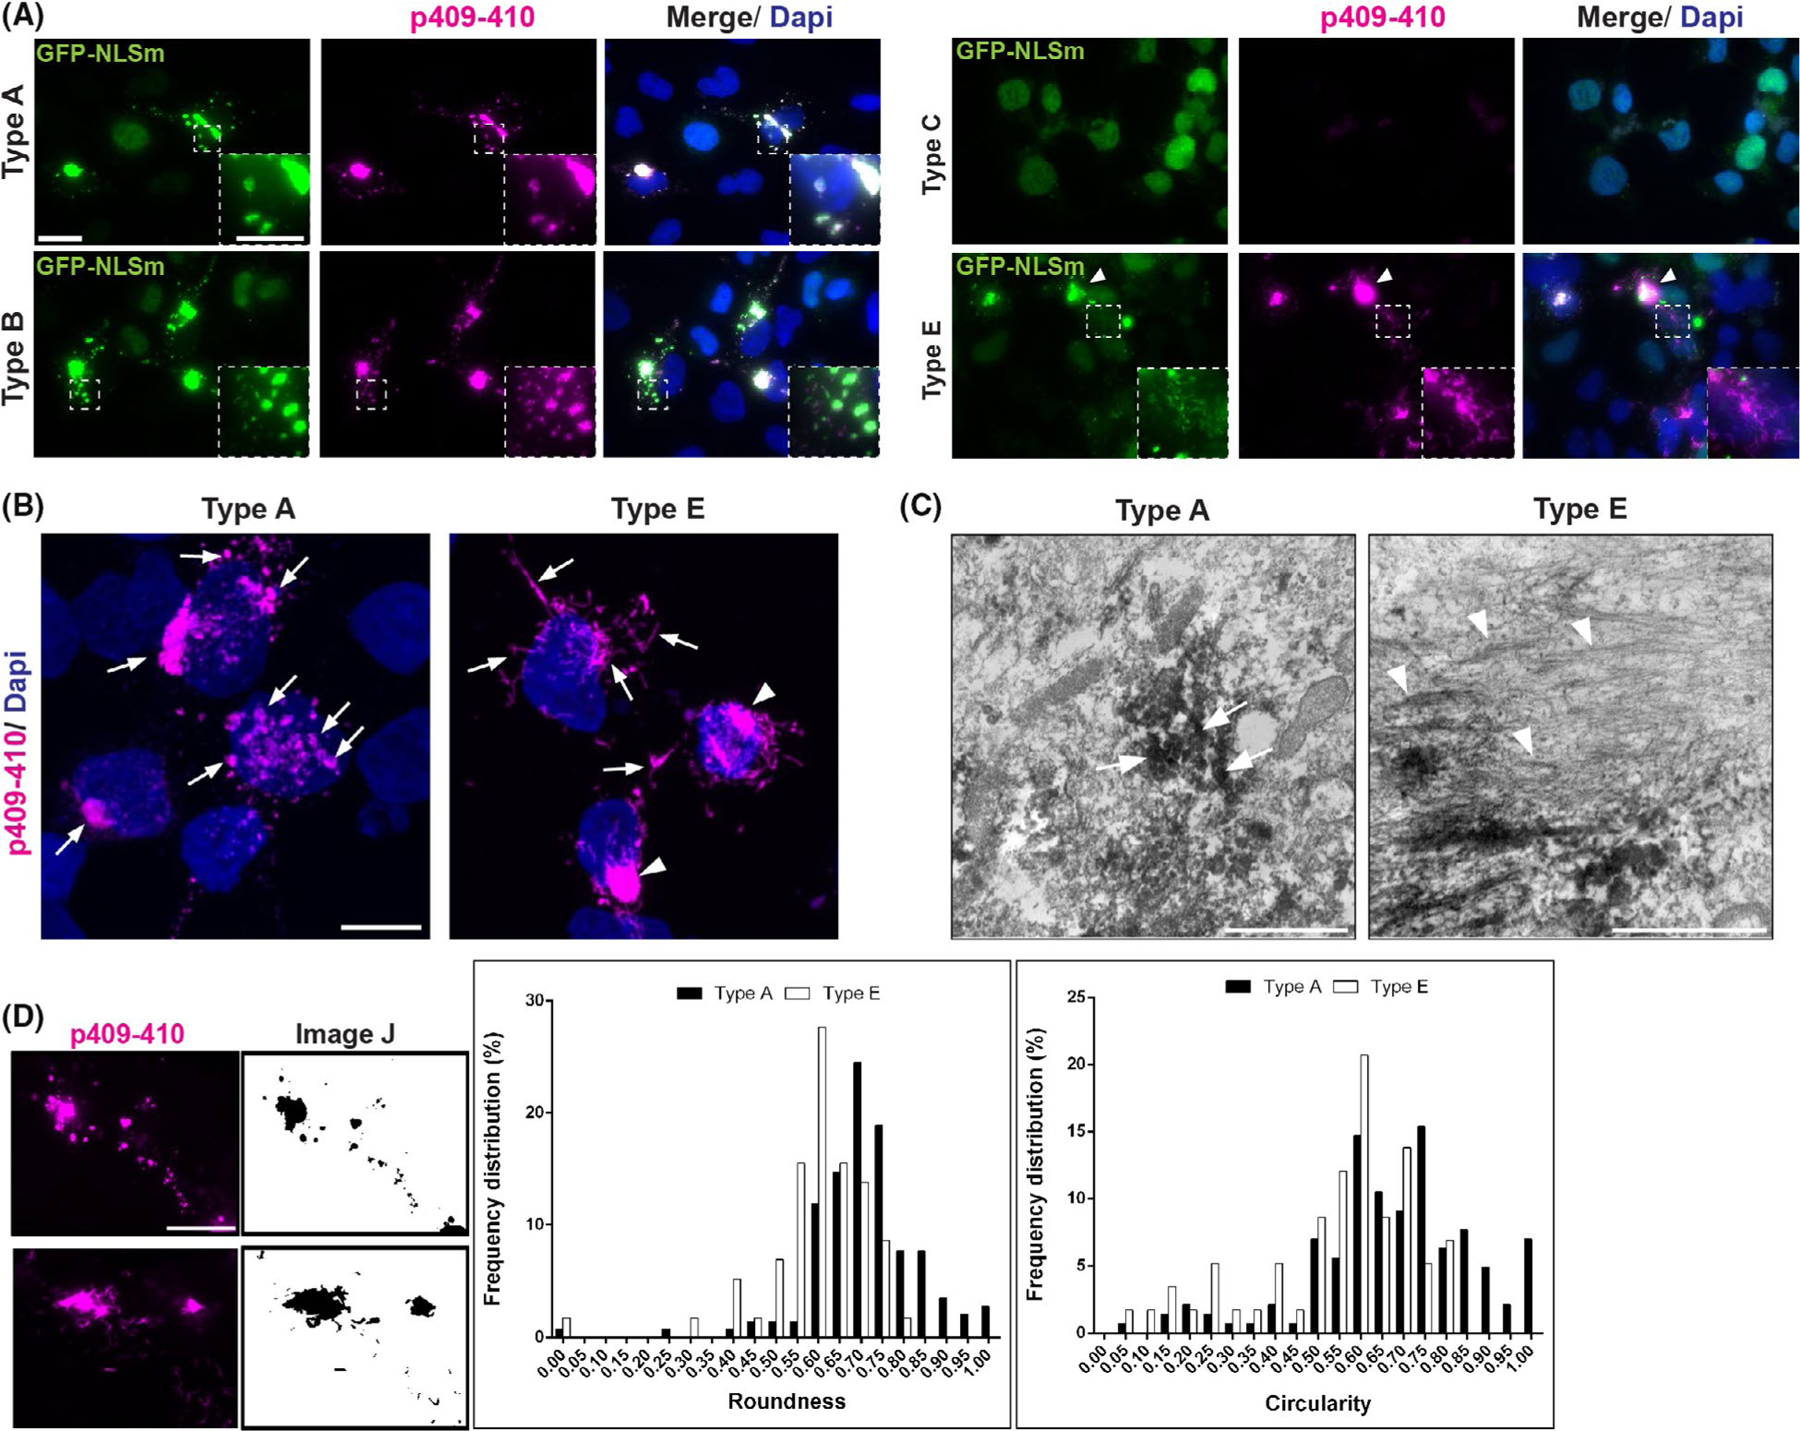
FIGURE 1.

Morphological differences in TDP-43 aggregates in GFP-NLSm expressing cells seeded with brain-derived TDP-43 extracts from distinct FTLD-TDP subtypes. (A) Representative ICC images of GFP-NLSm expressing cells (green and merge) transduced with sark-insoluble brain extracts from different FTLD-TDP subtypes at 3 days post-transduction (dpt) showing 1% Ttriton-insoluble phospho-TDP-43-positive cytoplasmic aggregates (p409–410, magenta and merge). Cells were counterstained with DAPI to label the nuclei (blue). Insets show a magnification of spherical TDP-43 aggregates seeded by type A and type B extracts, and small linear, straight and wavy structures hence wisps seeded by type E extracts. Arrowhead points to heterogeneous filamentous structures hence skein-like aggregates seeded by type E extracts. Scale bar = 20 μm, insets bar = 10 μm. (B) Representative ICC images of a Z-stack maximum projection by confocal microscopy. Arrows point to characteristic p409–410-positive spherical aggregates (magenta) in GFP-NLSm expressing cells transduced with type A. Arrows and arrowheads point to p409–410-positive wisps and skein-like aggregates, respectively, in cells transduced with type E extracts (see also Movies 1 and 2). Cells were counterstained with DAPI to label the nuclei (blue). Scale bar = 10 μm. (C) Immunoelectron microscopy (EM) images show the ultrastructure of p409–410-positive spherical (arrows) and filamentous (arrowheads) aggregates in iGFP-NLSm cells transduced with type A and type E extracts respectively. Note the filaments are most evident where the immunolabelling is faint. Scale bar = 2 μm; insets bar = 1 μm. (D) Examples of immunofluorescent images (left panels, magenta) converted to digital binary images using ImageJ software (right panels) used to measure the roundness and circularity parameters of the silhouettes of p409–410-positive aggregates at 3dpt. Scale bar = 20 μm. Plots show percentages of the frequency distributions of roundness (left plot) and circularity (right plot) of p409–410-positive aggregates in GFP-NLSm expressing cells transduced with type A (black bars) vs. type E (white bars) extracts at 3 dpt. The calculated roundness and circularity distributions ranged from 0 to 1.0 values with 0.05 intervals. Statistically significant differences in the cumulative distribution of roundness and circularity between p409–410 aggregates in type A vs. type E seeded cells were found using the Kolmogorov–Smirnov unpaired t-test (p < 0.0001)
