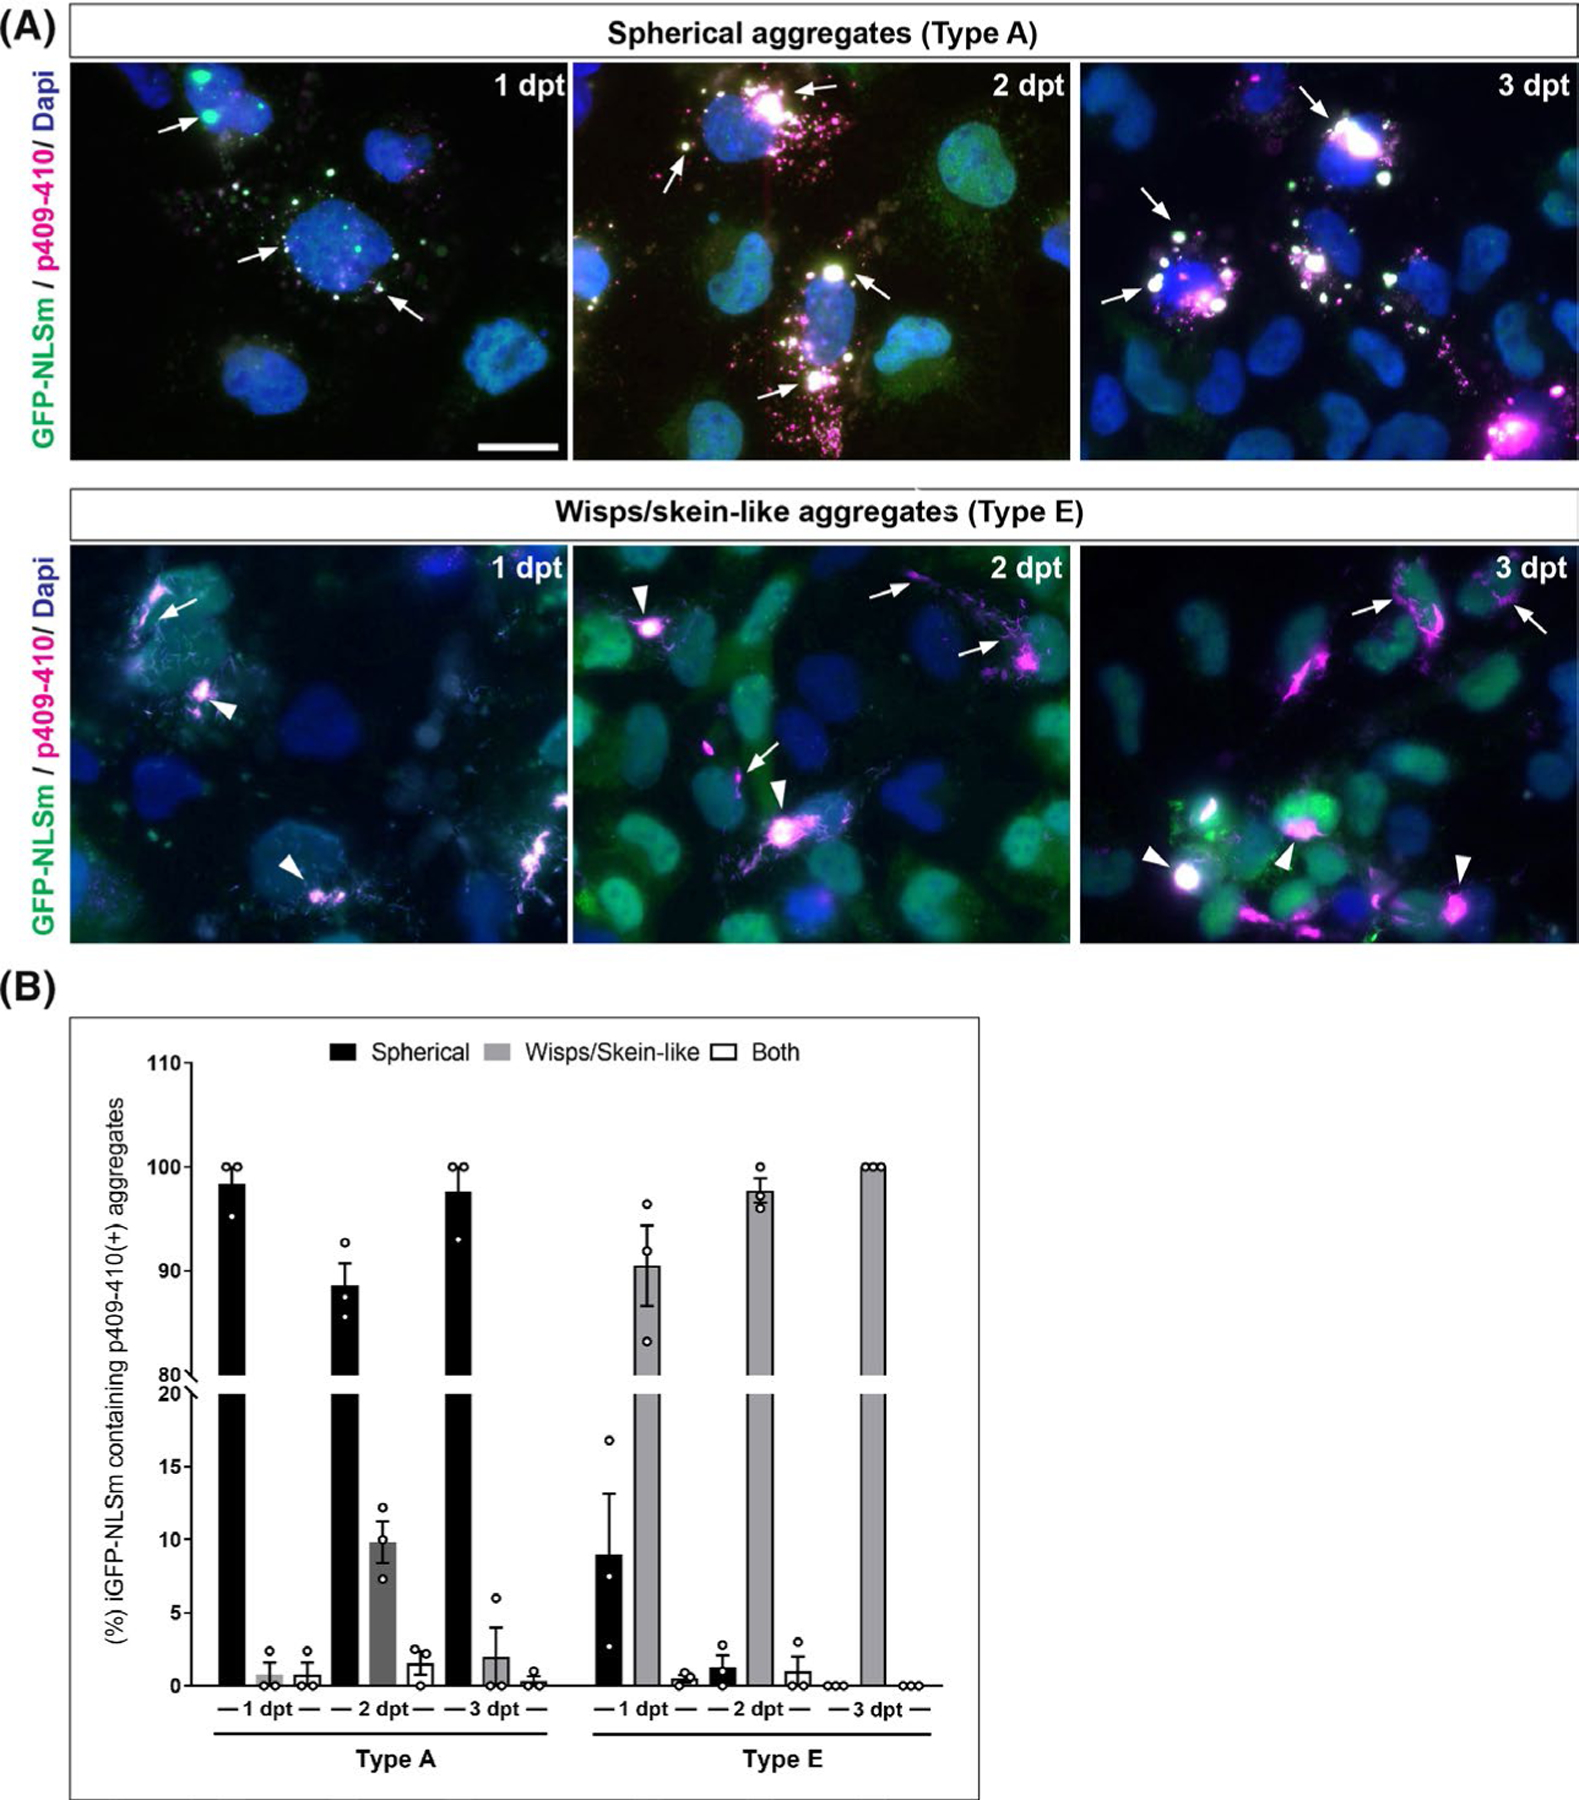
FIGURE 2.

Time course characterisation for the formation of TDP-43 aggregates and their uniformity. (A) Representative ICC images show the formation of cytoplasmic p409–410-positive TDP-43 aggregates (magenta) in GFP-NLSm expressing cells (green) at 1, 2, and 3 dpt. Top panels show characteristic spherical aggregates induced when type A brain extracts are used as seeds (arrows) Bottom panels show characteristics wisps and skein-like aggregates induced by type E seeds (arrows and arrowheads respectively). Cells were counterstained with DAPI to label the nuclei (blue). Scale bar = 20 μm. (B) Plots show the percentages of GFP-NLSm expressing cells bearing p409–410-positive TDP-43 aggregates overtime that are categorised by different morphological features such as spherical (black bars), wisps/skein-like (grey bars) or both (white bars). Bar plots show the mean ± SEM. Each white dot represents a biological replicate (n = 3)
