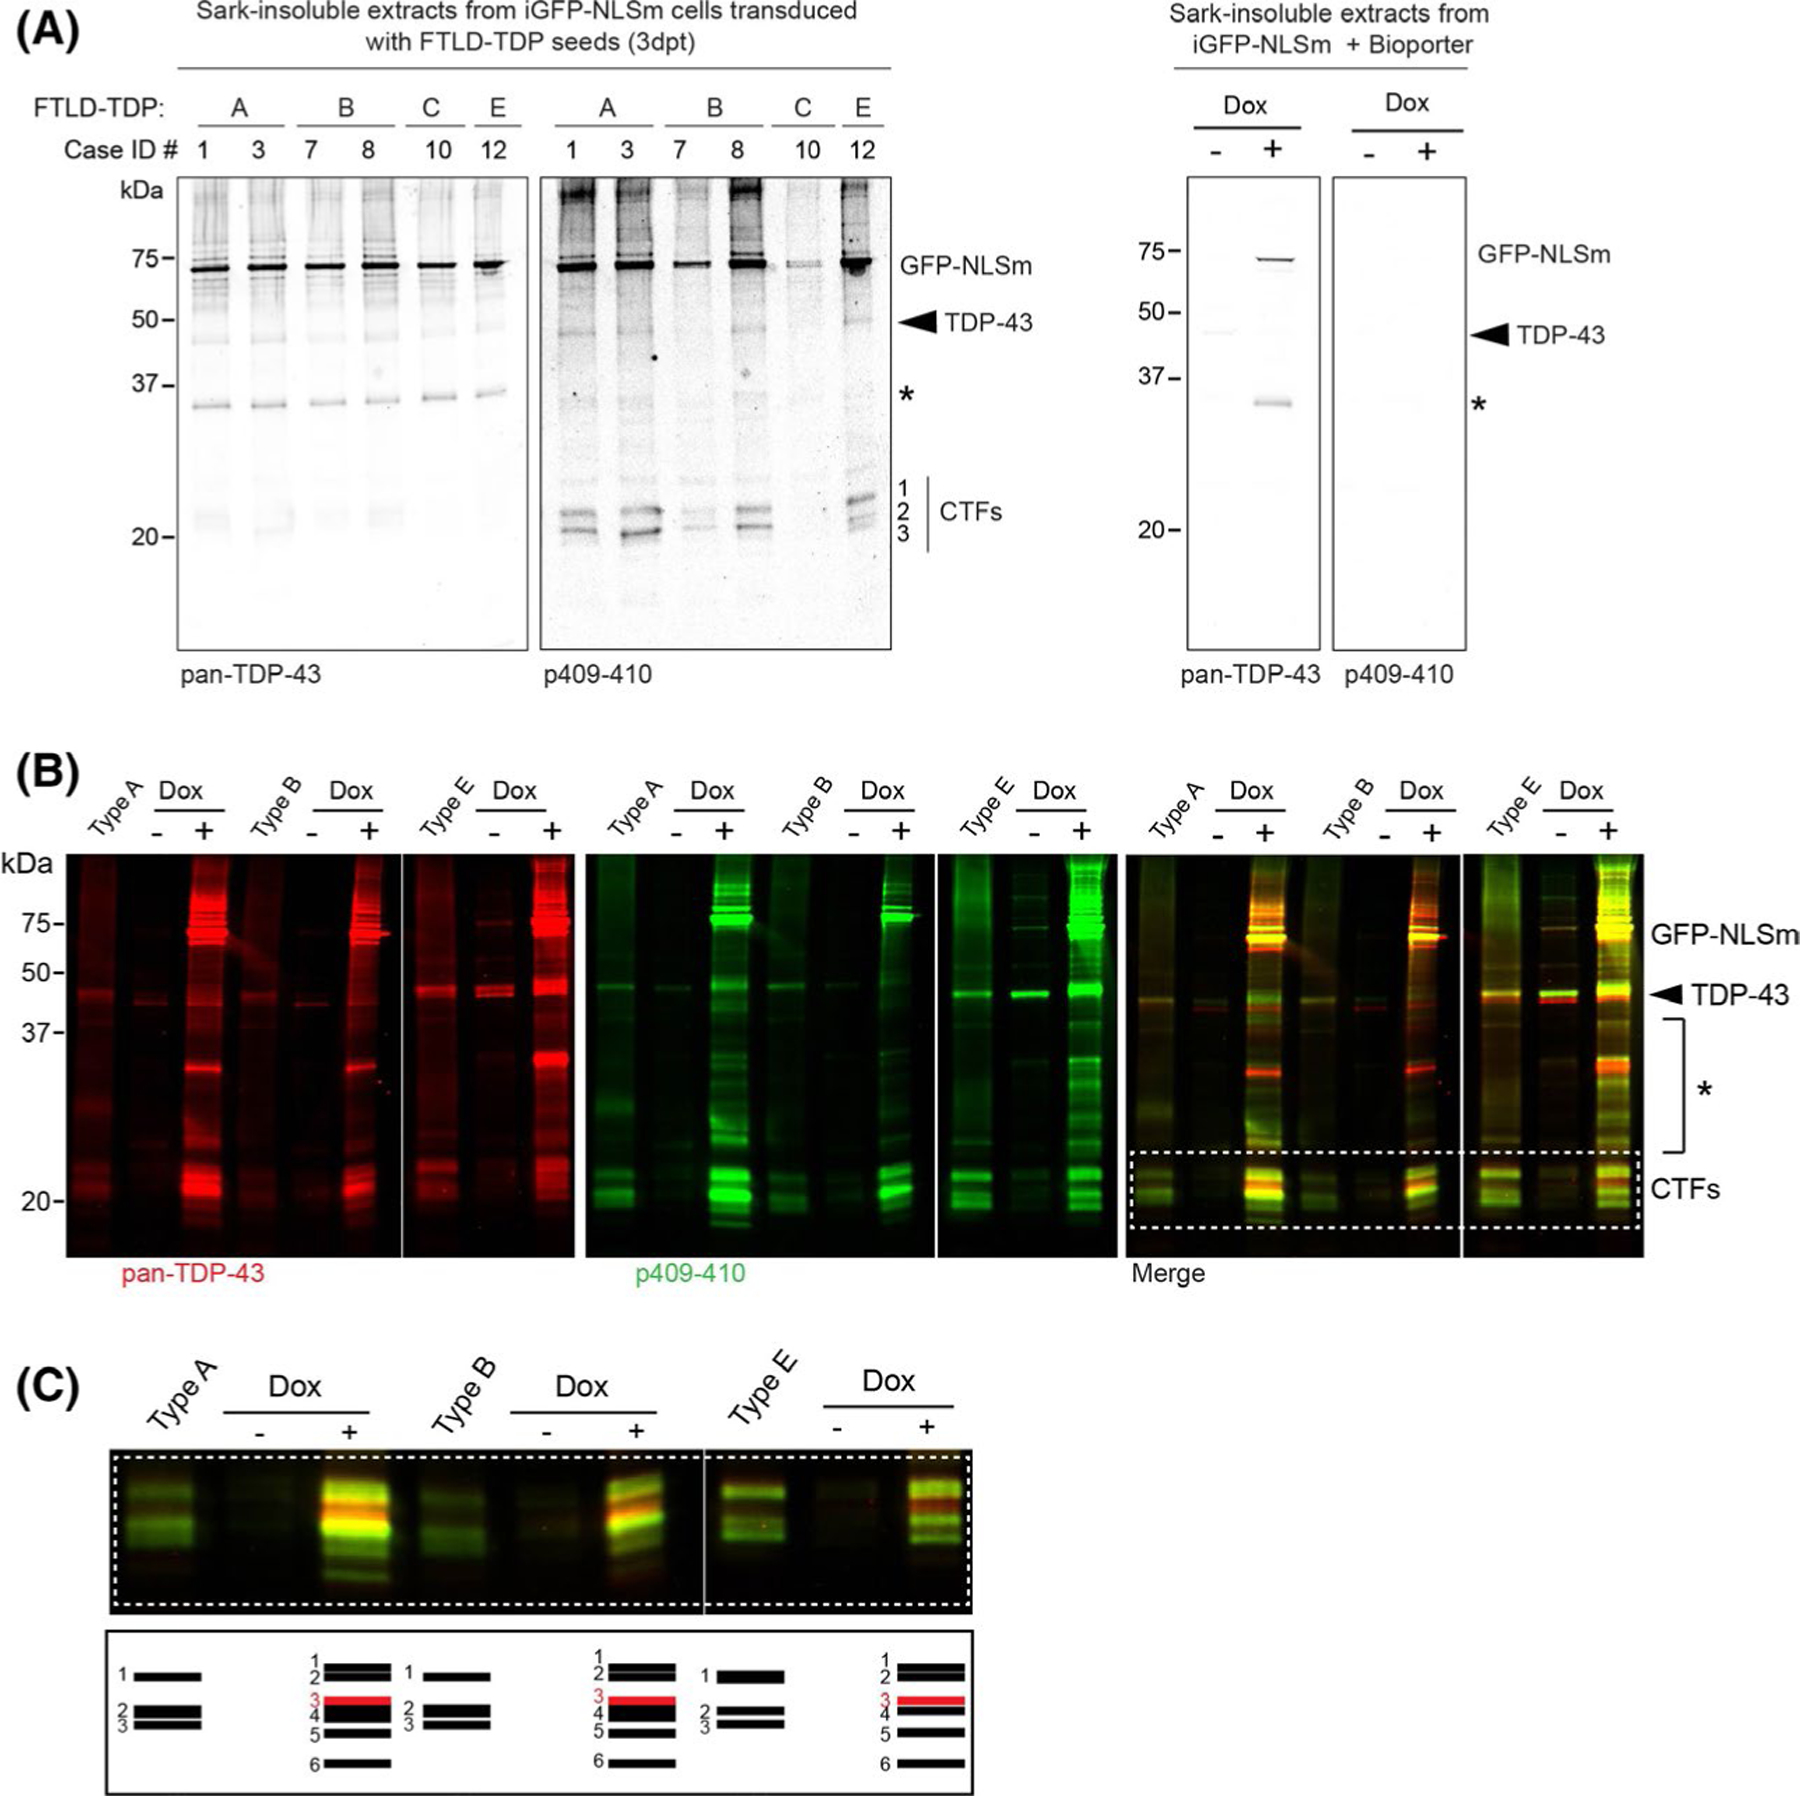
FIGURE 3.

Distinct biochemical banding patterns of sark-insoluble TDP-43 proteins recovered from iGFP-NLSm cells transduced with pathogenic seeds from different FTLD-TDP subtypes. (A) Representative immunoblot analysis of the sark-insoluble fraction from GFP-NLSm expressing cells transduced with different FTLD-TDP subtypes (left panels, type A, B, C and E) and transduction reaction in presence or absence of dox (Dox− and Dox+, Bioporter, right panels). Cases are identified by numbers corresponding to those in Table S1 (Case ID #). A C-terminal TDP-43 antibody was used to detect pan-TDP-43 protein, and the phosphorylation-specific mAb Ser409/Ser410 (p409–410) was used to detect pathological TDP-43. Molecular weight markers in kDa are shown on the left and the position of the GFP-NLSm proteins, endogenous TDP-43 proteins (arrowhead), and three major bands corresponding to C-terminal fragments (CTFs, band #1, #2 and #3) and an N-terminal TDP-43 truncated fragment (asterisk) are shown on the right. (B) Immunoblot analysis of the sark-insoluble fractions from FTLD-TDP cases used as seeds (lanes type A, B and E) and the corresponding sark-insoluble fraction from the iGFP-NLSm cells transduced in the absence (lanes, Dox −) or presence of doxycycline (lanes Dox +) at 3 dpt. A C-terminal TDP-43 antibody (red and merged with green) was used to detect pan-TDP-43 protein and the p409–410 mAb was used to detect the pathological TDP-43 (green and merged with red). Molecular weight markers in kDa are shown on the left and the positions of the GFP-NLSm protein, endogenous TDP-43 protein (arrowhead, ~43 kDa), intermediate TDP-43 truncated fragments (asterisk), and three major bands corresponding to C-terminal fragments (CTFs) are shown on the right. White dashed box framing the CTF bands is shown for magnification standards in C (top panel). The schematic diagram in c (bottom panel) illustrates the distinct banding patterns of TDP-43 CTFs in the sark-insoluble extracts from the brains of patients with different FTLD-TDP subtypes (lanes type A, B and E) and the GFP-NLSm expressing cells (Dox+) transduced. The corresponding FTLD-TDP extracts also are shown here
