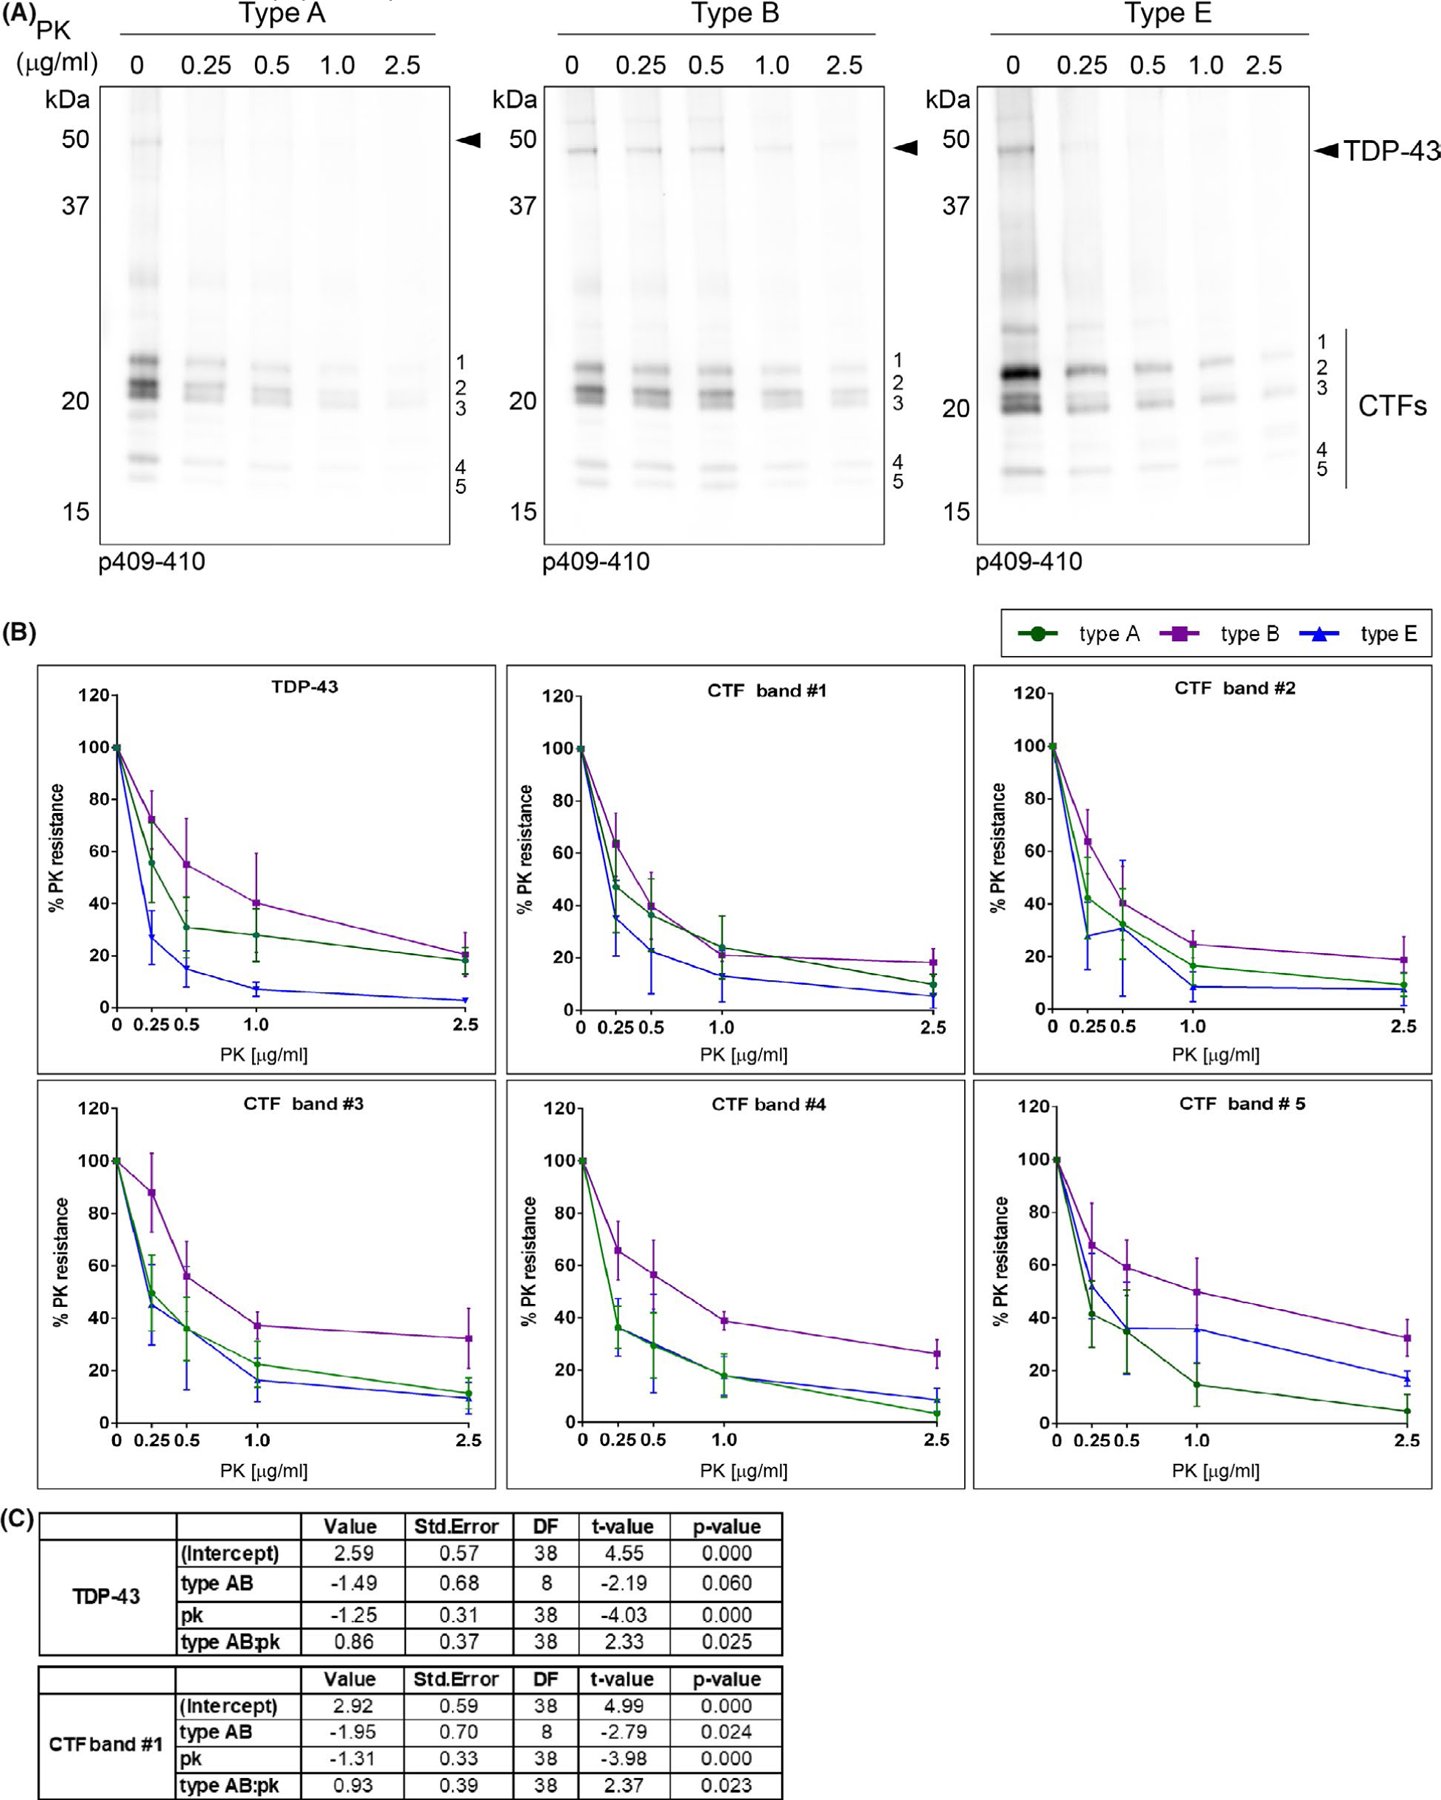
FIGURE 4.

Differences in PK resistance of insoluble TDP-43 protein between different FTLD-TDP subtypes. (A) Representative immunoblots show the digestion pattern of TDP-43 protein of sark-insoluble brain extracts (type A, type B and type E) treated with proteinase K (PK) using the p409–410 antibody. The different concentrations of PK (μg/ml) used in the assay are labelled in each lane. Molecular weight markers in kDa are shown on the left. Immunoblot show showed the presence of the full-length TDP-43 protein with a Mr of ~43 kDa (arrowhead) and the characteristic CTFs resulting from partial proteolysis including three major bands with a theoretical Mr ranging between ~20–26 kDa (bands #1, #2 and #3) and two minor bands at ~18–19 kDa (bands #4 and #5) on the right. (B) The signal of each p409–410-positive TDP and CTF band was quantified at each PK concentration as a percentage of the initial sample (PK = 0) and plotted as a percent of the PK resistance (%). Plots show the mean values (type A n = 4 cases, type B n = 3 cases, type E n = 3 cases) and whiskers SEM. (C) A linear mixed-effects model shows statistically significant differences in PK resistance of full-length TDP-43 proteins (TDP-43) and the C-terminal fragment with lower electrophoretic mobility (band #1) in type E extracts relative to type A and B extracts (TDP-43 p = 0.025, CTF band #1 p = 0.023)
