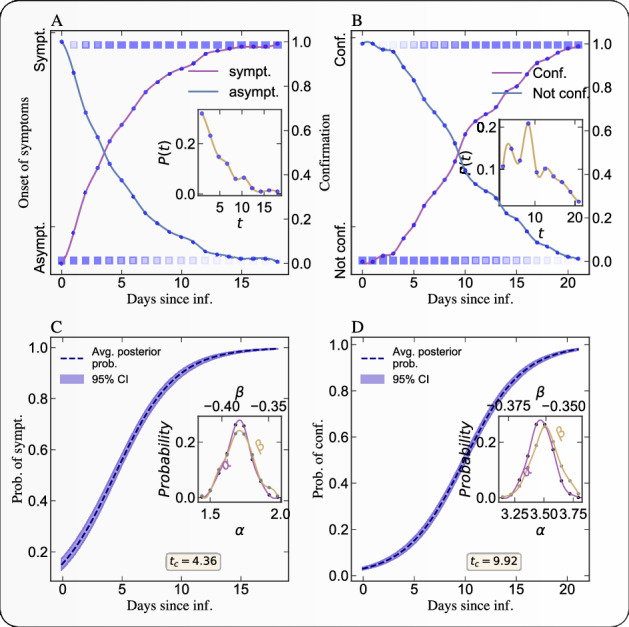
Figure 10.

Bayesian inference of the incubation period and confirmation period. A) Empirical cumulative probability of developing a symptom on a particular day following the day of exposure to the virus. We use individual level clinical data9,10 to conduct these Bayesian estimations. The lighter color of the square represents low probability and the deep color represents high probability. The solid lines represent the fraction of people remaining asymptomatic (decreasing curve) or becoming symptomatic (increasing curve) on a given day. following exposure. The inset figure represents the empirical probability distribution of duration between the date of exposure and the date of onset of symptom or the clinical confirmation. B) Same as A) but for the probability of being confirmed. C) Estimation of the posterior probability distribution (with 95% confidence interval) of the incubation period (i.e., of getting the clinical confirmation on , provided the individual is exposed to the virus on ). The dashed solid line represents the most likely posterior probability estimation and the light band represent the 95% confidence interval. The inset figure presents the distributions of the two estimated parameters in the logistic model (1). D) Same as C) for the probability distribution of confirmation period. The median value (and also mode) of the incubation period is 4.38 days. The median value (and also mode) of the confirmation period is 9.94 days.
