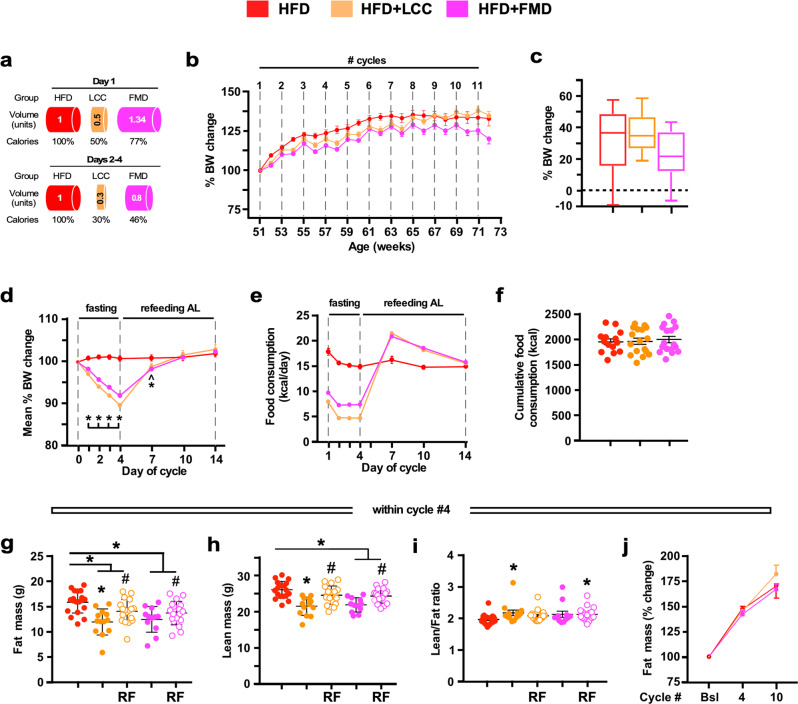
Fig. 2. Effect of 4:10 cycles on body weight, feeding behavior, and body composition in mice fed on HFD.
a Representation of the feeding regime. HFD, high-fat diet (red symbols); HFD + LCC, cycles of low-calorie intake under HFD (orange symbols); HFD + FMD, cycles of fasting-mimicking diet under HFD (pink symbols). Mice underwent a 4-day period of reduced energy restriction followed by a 10-day AL regime before initiating a new round of 4:10 fasting-refeeding cycle for a total of 11 cycles. b Body weight trajectories as percent change from baseline (HFD, n = 16–19; HFD + LCC and HFD + FMD, n = 17–18). c Cumulative percent body weight changes from baseline to cycle 11 (HFD, n = 16; HFD + LCC and HFD + FMD, n = 17). Data are represented as box plot [center line, median; box limits, upper and lower quartiles; whiskers minimum and maximum values]. d Average percent body weight change on each day of a representative 4:10 cycle (n = 11 cycles); e Average food consumption (kCal) on each day of a representative 4:10 cycle (n = 11 cycles). f Cumulative food consumption (kCal) from baseline to cycle 11 (HFD, n = 16; HFD + LCC and HFD + FMD, n = 17). g Measures of body fat and (h) lean mass by NMR and (i) lean-to-fat ratio calculation during cycle 4. Measures for HFD, HFD + LCC and HFD + FMD groups were collected on day 4, while the measures for HFD + LCC-RF and HFD + FMD-RF were acquired on day 14. Comparison by one-way ANOVA: *, p < 0.05 vs. HFD; #, p < 0.05 vs. HFD + LCC or HFD + FMD, respectively (HFD, n = 19; HFD + LCC, n = 13; HFD + LCC-RF, n = 18; HFD + FMD, n = 11; HFD + FMD-RF, n = 18). j Percent change in fat mass from baseline (Bsl) during refed phase of cycles 4 and 10, respectively (HFD, n = 17/16/13; HFD + LCC, n = 15/15/13; HFD + FMD, n = 14/14/11). All data are expressed as mean ± SEM. Comparison by two-tailed t-test unless otherwise noted; ^p < 0.1, *p < 0.05.

