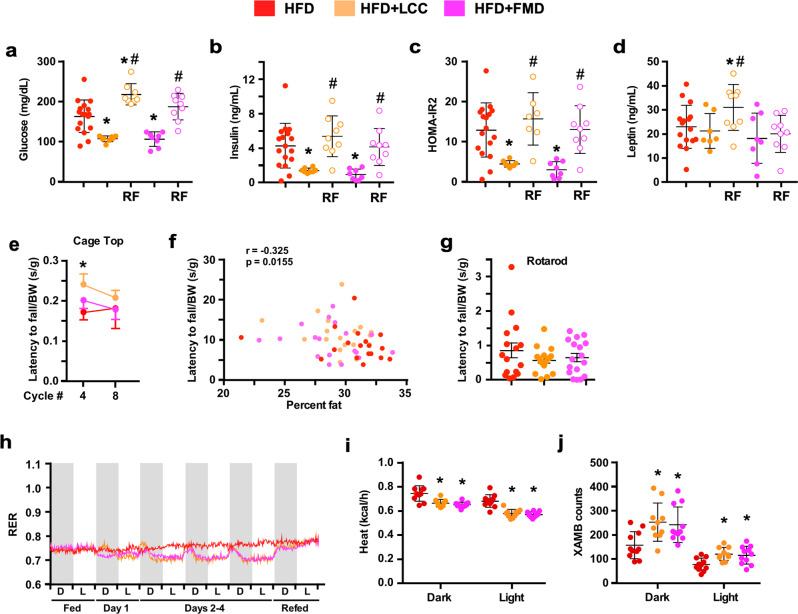
Fig. 4. Effect of 4:10 feeding cycles on health biomarkers in mice maintained on HFD.
a–d Circulating glucose, insulin, HOMA-IR2 calculation, and leptin levels in HFD-fed mice during cycle 9. Serum from HFD was collected on day 4 and day 11; Serum from HFD + LCC and HFD + FMD was collected on day 4; while serum from HFD + LCC-RF and HFD + FMD-RF was collected on day 11; Comparison by one-way ANOVA: *, p < 0.05 vs. HFD; #, p < 0.05 vs. LCC or FMD, respectively (HFD, n = 17; HFD + LCC, n = 8; HFD + LCC-RF, n = 7–9; HFD + FMD, n = 8; HFD + FMD-RF, n = 9). e–g All physical performance values were expressed as latency to fall (seconds) normalized by body weight (BW) in grams. e Inverted cage top tests were conducted on days 10–13 of cycles 4 and 8. (HFD, n = 18/17; HFD + LCC, n = 19/19; HFD + FMD, n = 18/17). f Spearman’s correlation between latency to fall from cage top and percent body fat during cycle 4. g Rotarod tests were conducted on day 11 of cycle 8 (HFD, n = 16; HFD + LCC and HFD + FMD, n = 17 per group). h–j Mice fed HFD were placed into metabolic cages during cycles 3 and 4 to measure h RER (HFD, n = 8–11; HFD + LCC, n = 8–10; HFD + FMD, n = 9–11), (i) averaged hourly heat production, and (j) ambulatory activity counts, (HFD, n = 11; HFD + LCC, n = 10; HFD + FMD, n = 11). Dark/light cycle represented in panel (h) by alternate gray/white bars. All data are expressed as mean ± SEM. Comparison by two-tailed t-test unless otherwise noted; *p < 0.05 vs. SD or HFD controls.

