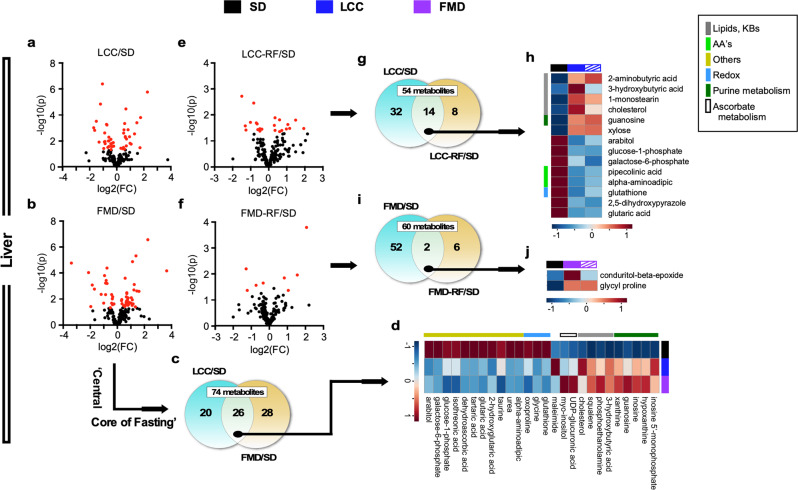
Fig. 6. Liver untargeted metabolomics study in LCC and FMD vs. SD-AL mice.
Livers from SD-AL controls were collected on day 3 and 11 (n = 8), livers from severely calorie-restricted LCC and FMD mice on day 3 (n = 7) and those from LCC-RF and FMD-RF animals on day 10 (n = 4) of the 4:10 cycle. a, b Volcano plots showing metabolites accounting for the effect of very low-calorie intake in (a) LCC and (b) FMD vs. SD-AL livers, respectively. c, d Venn diagram and heatmap illustrate the core metabolites, representing (c) metabolites associated with severe CR that were shared in LCC and FMD livers and (d) their relative average signal vs. SD-AL controls. e, f Volcano plot representing the separation between (e) LCC-RF and (f) FMD-RF livers vs. SD controls, respectively. g, h Venn diagram and heatmap illustrate the ‘Selective Metabolic Memory’—e.g., metabolites that were preserved between (a) the severely calorie-restricted LCC and (e) LCC-RF livers and (h) their relative average signal vs. SD-AL controls. i, j Venn diagram and heatmap of preserved metabolites between (b) the severely calorie-restricted FMD and (f) FMD-RF livers and (j) their relative average signal vs. SD-AL controls. For all volcano plots, red symbols indicate metabolites above threshold (fold-change ≥ 1.2 or ≤ 0.83, raw p value ≤ 0.05). See Supplementary Table 1 for a complete list of significantly impacted metabolites by LCC and FMD 4:10 cycles in liver (a, b, e, f). See Supplementary Tables 2, 3 for signature metabolites after severe CR (d, liver) and their persistence after RF (h, liver), respectively.

