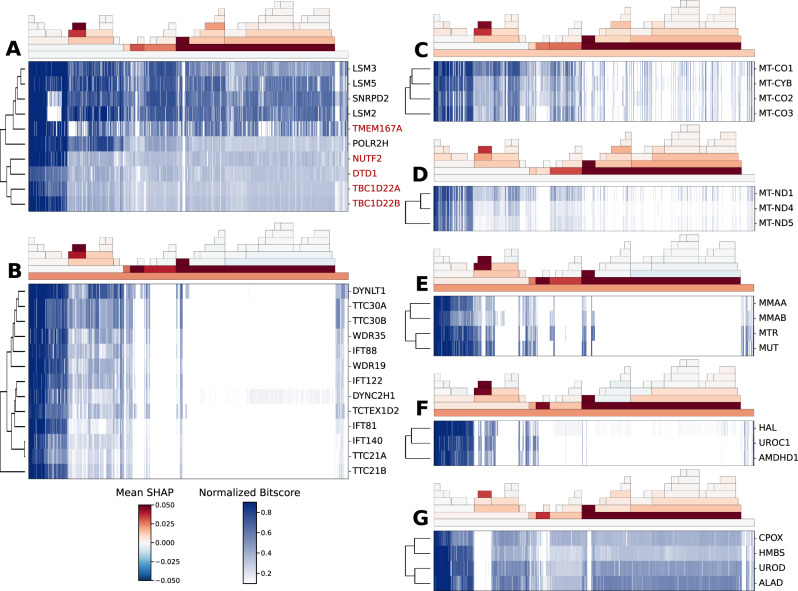
Fig. 3. Co-evolved gene clusters.
Model predictions for functional interaction were clustered using hierarchical clustering and cut at specific heights to produce clusters. For each of the clusters A–G, the top part is the clade importance for each clade calculated using the mean SHAP value, with species ordered from close (left) to distant (right) from human. The bottom part is the phylogenetic profile as self-hit normalized bitscores. Subfigures correspond to the co-evolved genes in the pathways mRNA splicing (A), cilia (B), mitochondrial respiratory complexes III and IV (C), NADH dehydrogenase (D), B12 metabolism (E), histidine metabolism (F) and heme biogenesis (G). Red entries in A denote genes not known to take part in mRNA splicing.

