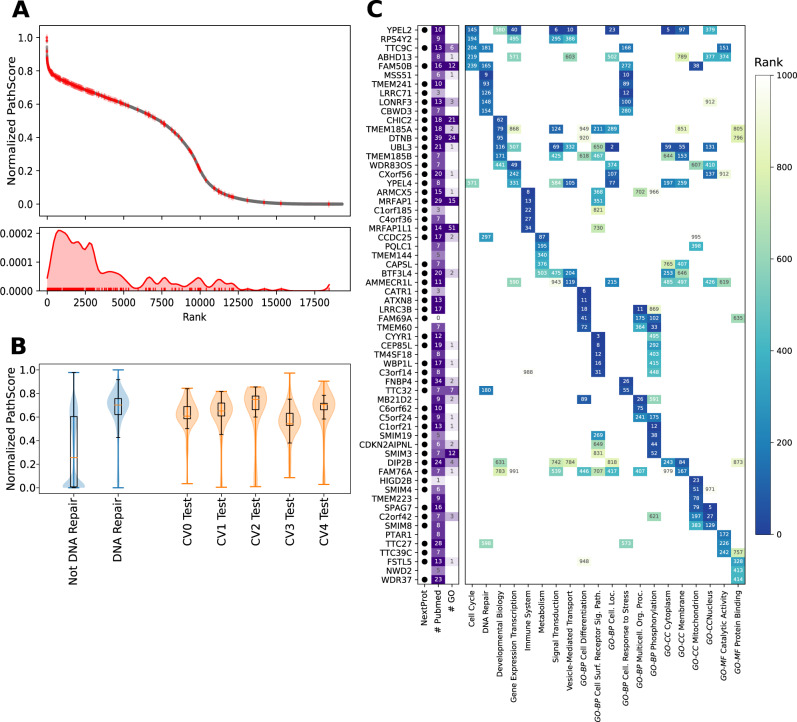
Fig. 4. Assigning genes with unknown functions to pathways types.
PathScore is a random-walk based measure identifying the importance of genes in a given network. The PathScore is calculated per label for all genes and prioritizes genes not known to belong to that pathway (gray) having equivalent or higher PathScores than known genes (red). Shown for the pathway type DNA repair (A). The PathScore is higher for genes belonging to a specific pathway and generalizes genes in the pathway found only in the test set. Shown for DNA repair (B, 240 known genes). Similar performance metrics appear in Supplementary Figs. 14-15 for the rest of the pathway types considered. The boxplot extends from the lower to upper quartile values of the data, with an orange line at the median. Whiskers denote 1.5 times the interquartile range. The top five less studied genes (having no function in UniProt in addition to low number of Pubmed mentions or appearing in NextProt uncharacterized genes set) are picked out for each pathway type and presented with their descending PathScore rank for the pathway types from Reactome and GO (C). Genes are annotated by whether they appear in the uncharacterized gene set in NextProt (by a dot to denote appearance in the list), number of Pubmed mentions (“# Pubmed”) and number of associated GO terms (“# GO”). GO—gene ontology. Source data are provided as a Source Data file.

