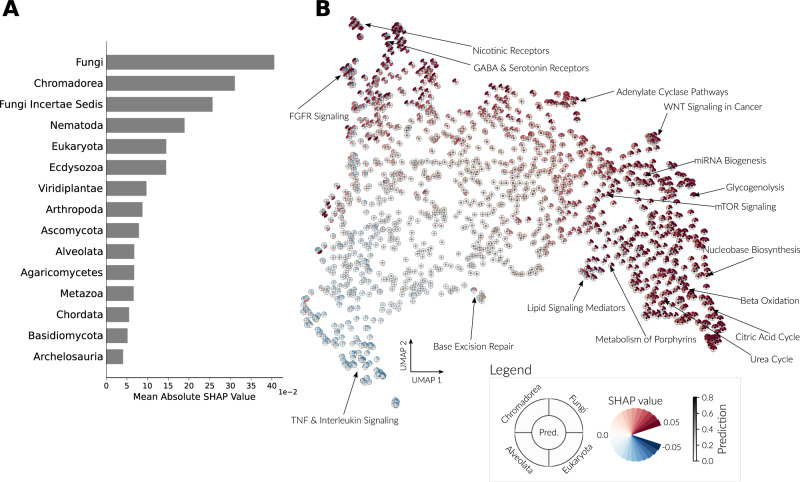
Fig. 6. Clade importance yields evolutionary insights.
Clade importance by SHAP values was calculated for the test set of a single cross-validation in the functional interaction model, revealing the clades with the highest mean absolute importance (A). Clade importance was averaged for each Reactome pathway and projected into two dimensions using UMAP (B). For each pathway, a marker is shown with the average SHAP value for one of four specific clades by the color of a quarter of the marker. The average predicted probability across gene pairs is shown by the color of the circle in the middle. Source data are provided as a Source Data file.

