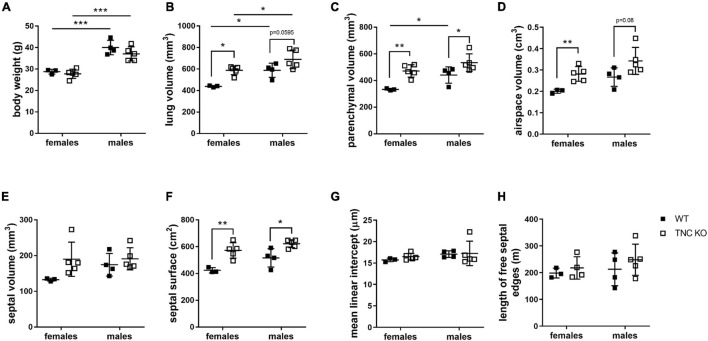
FIGURE 2.
Stereological analysis of old TNC-deficient and WT lungs. Stereological measurements were done on 5 μm sections of 18 months old WT (■) and TNC-deficient (□) females and males lungs. (A): body weight; (B): lung volume; (C): parenchymal volume; (D): airspace volume; (E): septal volume; (F): septal surface area; (G): mean linear intercept; (H): total length of free septal edges. Each point represents one animal; WT: N = 3–4 animals/gender and TNC KO: N = 5 animals/gender. Results are expressed as mean ± SD. Statistical analysis was made by two-way ANOVA; statistical significance was set at p < 0.05; *p < 0.05, **p < 0.01, ***p < 0.001.

