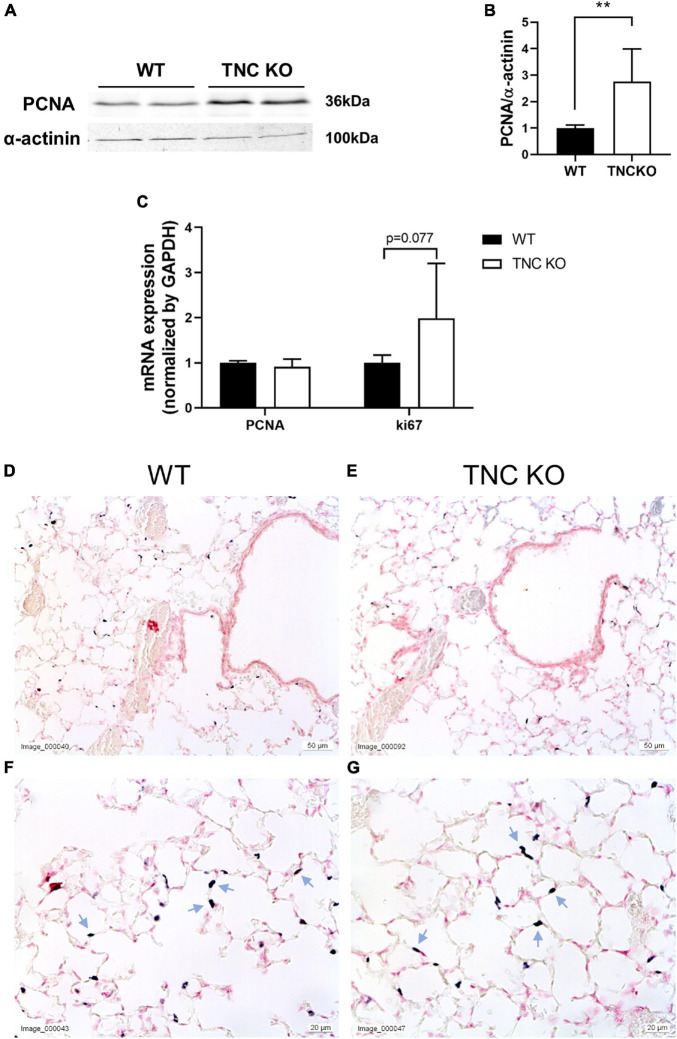
FIGURE 3.
Proliferation markers in old TNC-deficient and WT lungs. (A,B): representative results of PCNA protein detection in whole lung lysates from old TNC-deficient and WT animals by Western blot; quantification is shown in histogram; N = 6–7 animals/genotype. Cropped blots are displayed. (C): mRNA expression of PCNA and ki67 evaluated by RT-qPCR from whole lung lobe total RNA extraction of old TNC KO (□) and WT (■) animals. N = 6 animals/genotype. (D–G): representative images of lung sections from TNC KO and WT old animals immunostained with anti-ki67 antibody (dark gray; blue arrows) and counter-stained with Nuclear Red. N = 3–5 animals/genotype. For histograms: results are expressed as mean ± SD; statistical analyses were made by Student’s t test; statistical significance was set at p < 0.05; *p < 0.05, **p < 0.01.

