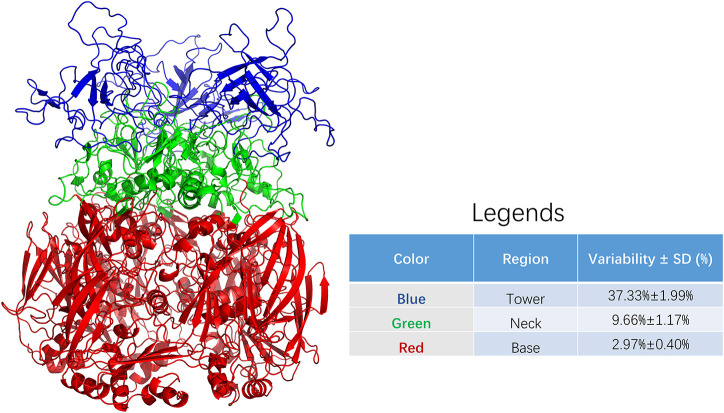
FIGURE 2.
Sequence variability among regions of adenoviral hexon. The adenoviral hexon was divided into three regions including the tower (colored blue), neck (colored green) and bottom (colored red). The variability of each residue based on amino acid sequence alignment from each region was summarized in the legends. The table in legends showed statistically significant differences with F = 331.190 and P < 0.001.

