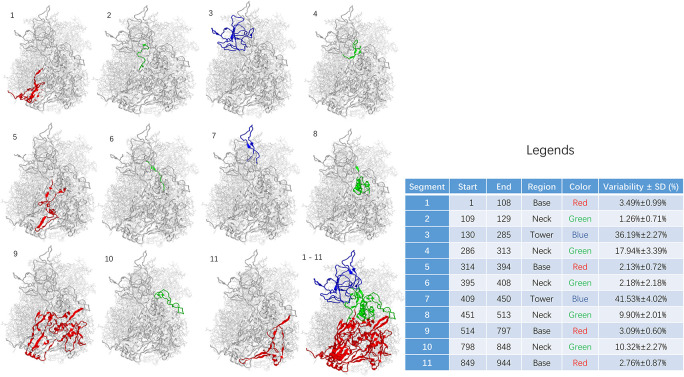
FIGURE 3.
Sequence variability among segments of adenoviral hexon. The base region including segment 1, 5, 9, and 11 was shown in RED. The neck region including segment 2, 4, 6, 8, and 10 was shown in GREEN. The tower region including segment 3 and 7 was shown in BLUE. Statistics for the table: F = 69.119 and P < 0.001.

