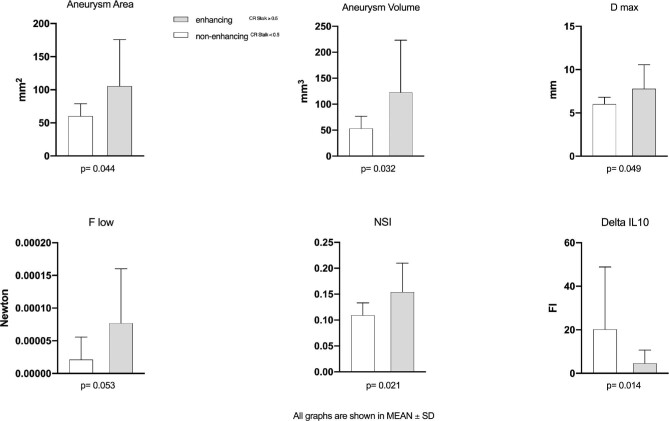
FIGURE 2.
Illustration of the mean values and the standard deviations for aneurysm area, aneurysm volume, D max, NSI, F low, and ΔIL-10. D max, maximum diameter of the aneurysm; NSI, nonsphericity index; F low, shear stress of the aneurysm area under low wall shear stress; ΔIL-10, differences in plasma concentration of IL-10.

