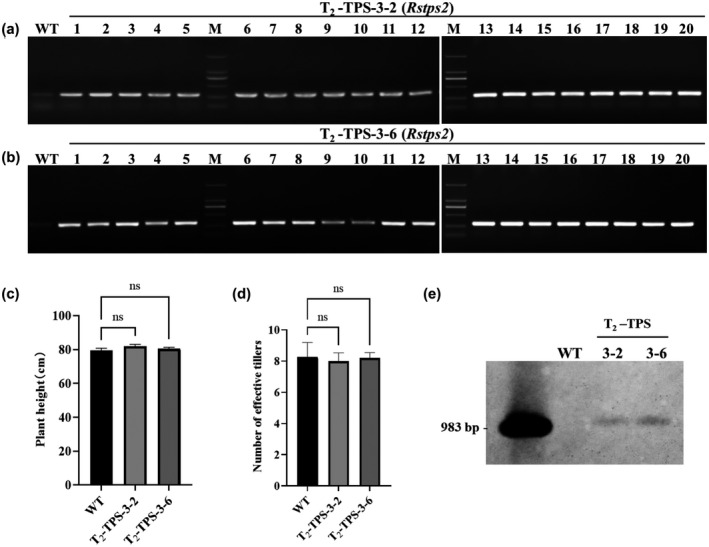
FIGURE 3.

Molecular analysis and morphological characteristics of homozygous T2 transgenic rice. (a,b) PCR analysis of T2 transgenic plants using Rstps2 gene‐specific primers. (c) Plant height. (d) Number of tillers. (e) Southern blot analysis showing the integration of the transgene in the T2‐Tps2 lines. Data are shown as the mean ± SE of triplicates. ns: no significant changes observed, one‐way analysis of variance and Tukey's test
