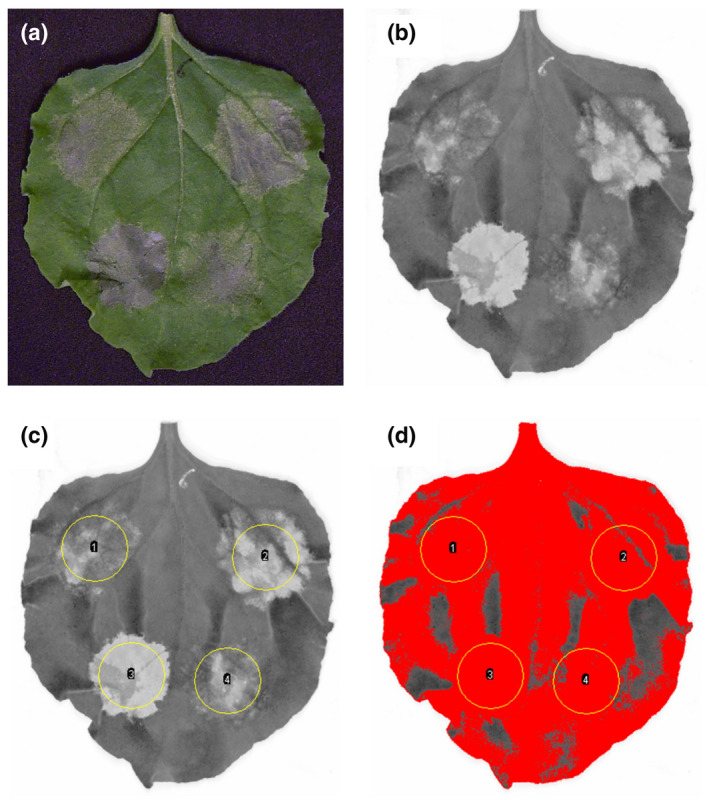
FIGURE 2.

Quantification of cell death in Nicotiana benthamiana by red fluorescence scanning. (a) Picture of a leaf taken 5 days after agro‐infiltration with constructs inducing cell death. (b) The leaf was scanned using the Typhoon FLA 9000 laser scanner. A 635‐nm laser was used for excitation and the light emitted by the leaf was quantified after passing through a 665‐nm long‐pass red filter. (c) Infiltrated areas of the leaf were delimited using the oval selection tool of ImageJ and the ROI (region of interest) manager tool. Parameters were set to quantify the mean grey value of each ROI after threshold adjustment. (d) A threshold was applied to the image to exclude dark areas caused by leaf veins and leaf shape. Within each ROI, the mean grey value is calculated using exclusively the pixels that appear in red. Equivalent parameters were used for all leaf images within each replicate of an experiment
