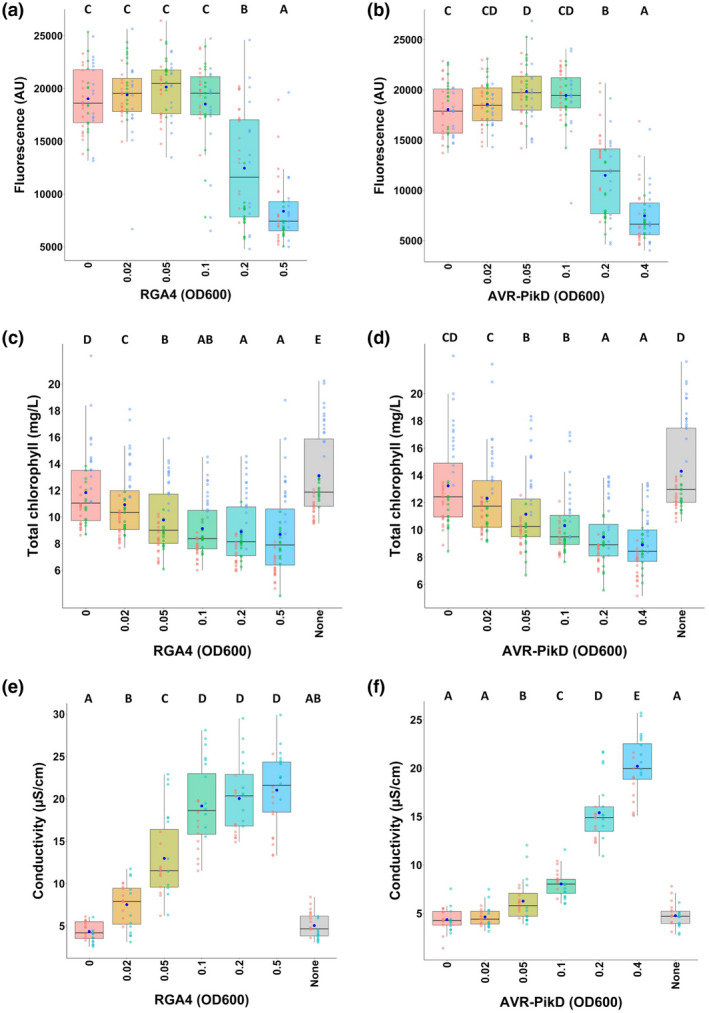
FIGURE 3.

Comparison of three methods for the quantification of immune responses. (a) Quantification of immune responses induced by different concentrations of agrobacteria carrying the RGA4:HA construct using red fluorescence scanning. Leaves were harvested 5 days after infiltration and imaged using a fluorescence scanner with a 635‐nm laser used for excitation and a long‐pass red filter (wavelength range ≥ 665 nm) to detect the red fluorescence of the leaves. Images were processed with ImageJ to measure the red fluorescence by quantifying the mean grey value for each infiltrated area (expressed as arbitrary units [AU]). Collected data were plotted and dots with different colours (i.e., red, green, and light blue) correspond to three biological replicates. The total number of replicates for each condition is 45. The boxes represent the first quartile, median, and third quartile and the dark blue dot indicates the mean value. Differences of red fluorescence levels were assessed by one‐way analysis of variance followed by a Tukey honestly significant difference test. Groups with the same letter (A to C) are not statistically different (p > .05). (b) Same as in panel (a) for the responses triggered by different concentrations of agrobacteria carrying the AVR‐PikD:HA construct coinfiltrated with steady amounts of agrobacteria expressing the Pikp‐1:Flag/Pikp‐2:HA construct (OD600 of 0.15). (c,d) Quantification of immune responses induced by distinct concentrations of agrobacteria carrying RGA4:HA (c) or AVR‐PikD:HA (with constant levels of Pikp‐1:Flag/Pikp‐2:HA) (d) by chlorophyll measurements. Chlorophyll was extracted from infiltrated areas 5 days after infiltration and chlorophyll quantification was performed by spectrophotometry. The absorbance was measured at λ = 649 nm and λ = 665 nm and total chlorophyll content was calculated as the sum of chlorophyll a (Chl a = 12.19 × A665 − 3.45 × A649) and chlorophyll b (Chl b = 21.99 × A649 − 5.32 × A665) content (Slootweg et al., 2017; Tait & Hik, 2003). The total number of replicates for each condition is 45. The experiment was carried out three times and data were plotted and analysed as in panel (a). (e,f) Quantification of immune responses induced by various concentrations of agrobacteria carrying RGA4:HA (e) or AVR‐PikD:HA (with constant levels of Pikp‐1:Flag/Pikp‐2:HA) (f) by ion leakage measurements. Samples were harvested from infiltrated areas 48 hr after infiltration, and the conductivity was measured after 20 hr incubation in deionized water. The experiment was carried out twice and the total number of replicates for each condition in each experiment is 24. Data were plotted and analysed as in panel (a)
