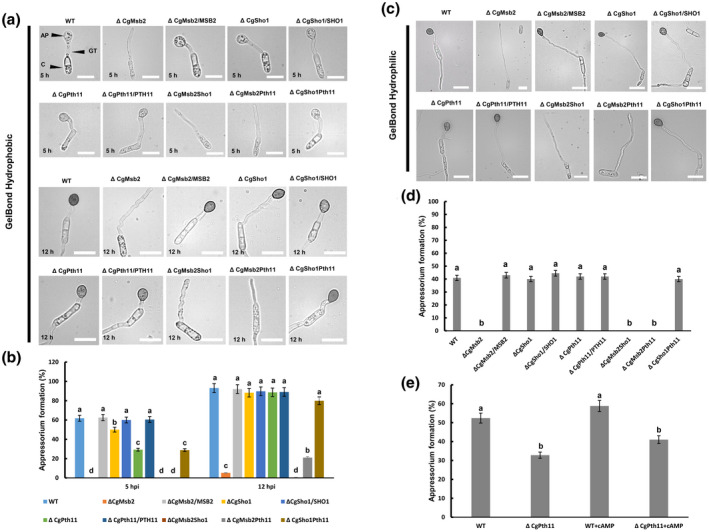
FIGURE 1.

Appressorium formation assays on hydrophobic and hydrophilic membranes. (a) Equal volumes (30 μl) of conidial suspension (2 × 10⁴/ml) of each strain were inoculated on the hydrophobic side of the GelBond membrane; the images were acquired at 5 and 12 hr postinoculation (hpi), respectively. AP, appressorium; GT, germ tube; C, conidia. Bars = 10 µm. (b) Bar chart showing the rate of appressorium formation on the hydrophobic side of the GelBond membrane at 5 and 12 hpi. At least 200 germinated conidia from each strain were measured to calculate the appressorium formation rate. Error bars represent the standard deviations based on three independent replicates. The values indicated by different letters are significantly different within the same treatment at p < .05, as determined using Tukey's post hoc test. (c) Equal volumes (30 μl) of conidial suspension (2 × 10⁴/ml) of each strain were inoculated on the hydrophilic side of the GelBond membrane; the images were acquired at 12 hpi. Bars = 10 µm. (d) Bar chart showing the rate of appressorium formation on the hydrophilic side of the GelBond membrane at 12 hpi. At least 200 germinated conidia from each strain were measured to calculate the appressorium formation rate. Error bars represent the standard deviations based on three independent replicates. The values indicated by different letters are significantly different within the same treatment at p < .05, as determined using Tukey's post hoc test. (e) Exogenous cAMP was mixed with conidial suspensions of the wildtype (WT) and ΔCgPth11 at a final concentration of 1.5 mM. The bar chart shows the appressorium formation rate on the hydrophobic side of the GelBond membrane at 5 hpi. The values indicated by different letters are significantly different within the same treatment at p < .05, as determined using Tukey's post hoc test
