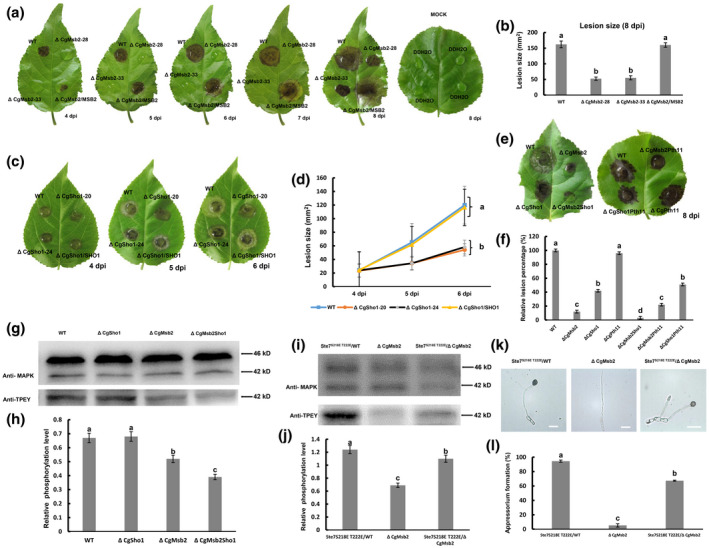
FIGURE 3.

Plant infection and western blot assays. (a) Detached poplar leaves were inoculated with wildtype (WT), ΔCgMsb2, or ΔCgMsb2/MSB2 (complemented) strains or mock‐inoculated with water. Images were pictured at 4–8 days postinoculation (dpi). (b) Bar chart showing the lesion size after inoculation with WT, ΔCgMsb2, and ΔCgMsb2/MSB2 at 8 dpi. Error bars represent the standard deviations based on three independent replicates. The values indicated by different letters are significantly different at p < .05, as determined using Tukey's post hoc test. (c) Detached poplar leaves were inoculated with WT, ΔCgSho1, and ΔCgSho1/SHO1. (d) Line chart showing the lesion size of WT, ΔCgSho1, and ΔCgSho1/SHO1 at 4–6 dpi. Error bars represent the standard deviations based on three independent replicates. The values indicated by different letters are significantly different at p < .05, as determined using Tukey's post hoc test. (e) Detached poplar leaves were inoculated with WT, ΔCgMsb2, ΔCgSho1, ΔCgMsb2Sho1, ΔCgPth11, ΔCgMsb2Pth11, and ΔCgSho1Pth11. Images were taken at 8 dpi. (f) Bar chart showing the relative lesion size of each strain, normalized to the WT lesion size (100%). Error bars represent the standard deviations based on three independent replicates. The values indicated by different letters are significantly different at p < .05, as determined using Tukey's post hoc test. (g) Western blot analysis of the CgMk1 phosphorylation level in WT, ΔCgSho1, ΔCgMsb2, and ΔCgMsb2Sho1. Anti‐MAPK was used to detect the expression levels of CgMk1 (42 kDa) and putative CgSlt2 (46 kDa), and anti‐TPEY was used to detect the phosphorylation level of CgMk1 (42 kDa). (h) Bar chart showing the relative phosphorylation level of CgMk1 in WT, ΔCgSho1, ΔCgMsb2, and ΔCgMsb2Sho1 compared with that of the overall CgMk1 content in each respective strain. Data were taken from two biological replicates with similar results. Error bars represent the standard deviations based on two independent replicates. The values indicated by different letters are significantly different at p < .05, as determined using Tukey's post hoc test. (i) Western blot analysis of the CgMk1 phosphorylation level in Ste7 S218E T222E/WT, ΔCgMsb2, and Ste7 S218E T222E/ΔCgMsb2. Anti‐MAPK was used to detect the expression levels of CgMk1 (42 kDa) and putative CgSlt2 (46 kD), and anti‐TPEY was used to detect the phosphorylation level of CgMk1 (42 kDa). (j) Bar chart showing the relative phosphorylation level of CgMk1 in Ste7 S218E T222E/WT, ΔCgMsb2, and Ste7 S218E T222E/ΔCgMsb2 compared with that of the overall CgMk1 content in each respective strain. Data were taken from two biological replicates with similar results. Error bars represent the standard deviations based on two independent replicates. The values indicated by different letters are significantly different at p < .05, as determined using Tukey's post hoc test. (k) Appressorium formation of Ste7 S218E T222E/WT, ΔCgMsb2, and Ste7 S218E T222E/ΔCgMsb2 on the hydrophobic side of a GelBond membrane. Bars = 10 µm. (l) Bar chart showing the rate of appressorium formation in (k). Error bars represent the standard deviations based on three independent replicates. The values indicated by different letters are significantly different at p < .05, as determined using Tukey's post hoc test
