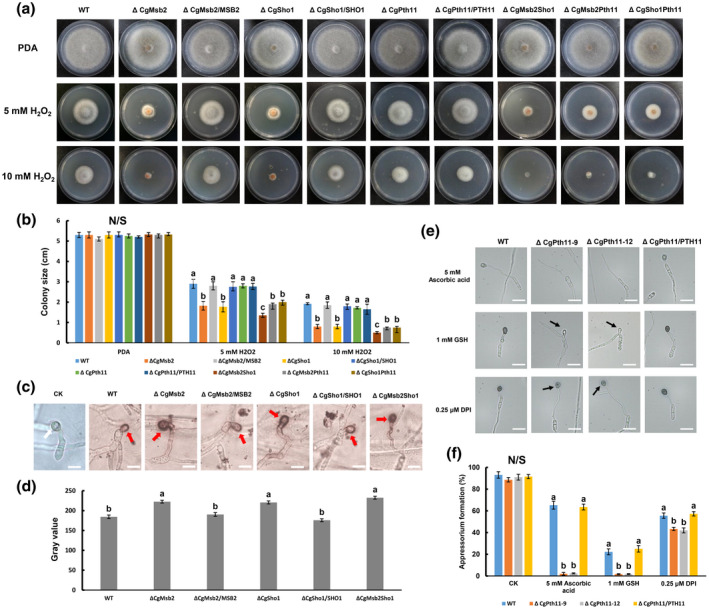
FIGURE 6.

Responses to oxidative stress and antioxidants, and 3,3'‐diaminobenzidine (DAB) staining assays. (a) Colonies of wildtype (WT), ΔCgMsb2, ΔCgSho1, ΔCgPth11, ΔCgMsb2Sho1, ΔCgMsb2Pth11, ΔCgSho1Pth11, and complementation strains on potato dextrose agar (PDA) and PDA supplemented with 5 mM or 10 mM H2O2. Plates were incubated for 4 days at 25 °C. (b) Bar chart showing the colony size of strains in (a). Error bars represent the standard deviations based on three independent replicates. The values indicated by different letters are significantly different within the same treatment at p < .05, as determined using Tukey's post hoc test. N/S = difference not significant. (c) Accumulated reactive oxygen species (ROS) during infection of each strain were stained using 1 mg/ml DAB for 12 hr in darkness. DAB is converted to dark brown polymers in the presence of ROS. Images were captured by light microscopy. CK = image of appressorium on onion epidermal cells. A white arrow indicates an unstained appressorium. A red arrow indicates a site of ROS deposition. Bars = 10 µm. (d) The deposition of dark brown polymers was analysed using ImageJ. Data from at least 15 appressoria were collected from each strain in each replicate. Bar chart showing the grey value of each strain. Error bars represent the standard deviations based on three independent replicates. The values indicated by different letters are significantly different at p < .05, as determined using Tukey's post hoc test. (e) Conidial suspensions of WT, ΔCgPth11, and ΔCgPth11/PTH11 complementation strain were mixed with antioxidants L‐glutathione (GSH), ascorbic acid, and diphenyleneiodonium chloride (DPI) at final concentrations of 1 mM, 5 mM, and 0.25 μM, respectively, and inoculated on the hydrophobic side of a GelBond membrane. Images were photographed at 12 hr postinoculation. A black arrow indicates an appressorium with reduced melanization. Bars = 10 µm. (f) Bar chart showing the appressorium formation rate of each strain in (e). At least 200 germinated conidia from each strain were measured to calculate the appressorium formation rate. Error bars represent the standard deviations based on three independent replicates. The values indicated by different letters are significantly different within the same treatment at p < .05, as determined using Tukey's post hoc test. N/S = difference not significant
