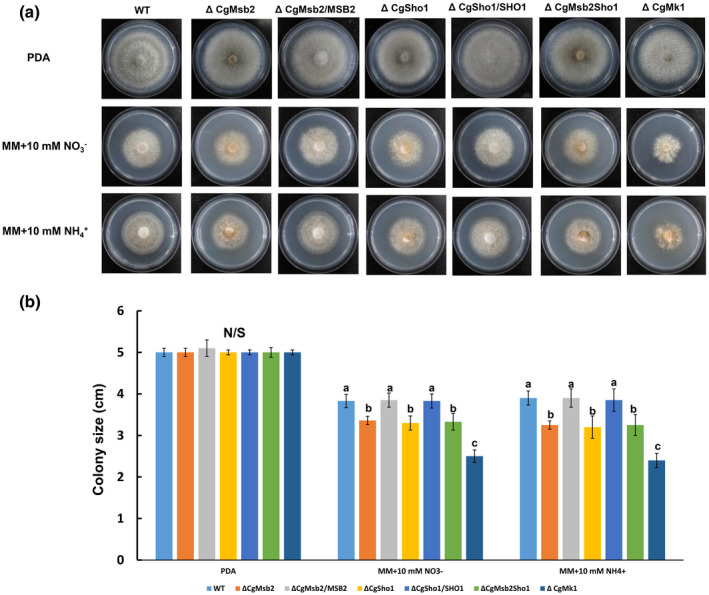
FIGURE 7.

Vegetative growth under nitrogen‐limiting conditions. (a) Colonies of wildtype (WT), ΔCgMsb2, ΔCgSho1, ΔCgMsb2Sho1, ΔCgMk1, and complementation strains on potato dextrose agar (PDA) and minimal medium (MM) supplemented with 10 mM and , respectively. Plates were incubated for 4 days at 25 °C. (b) Bar chart showing the colony size of strains grown under different nitrogen sources. Error bars represent the standard deviations based on three independent replicates. The values indicated by different letters are significantly different within the same treatment at p < .05, as determined using Tukey's post hoc test. N/S = difference not significant
