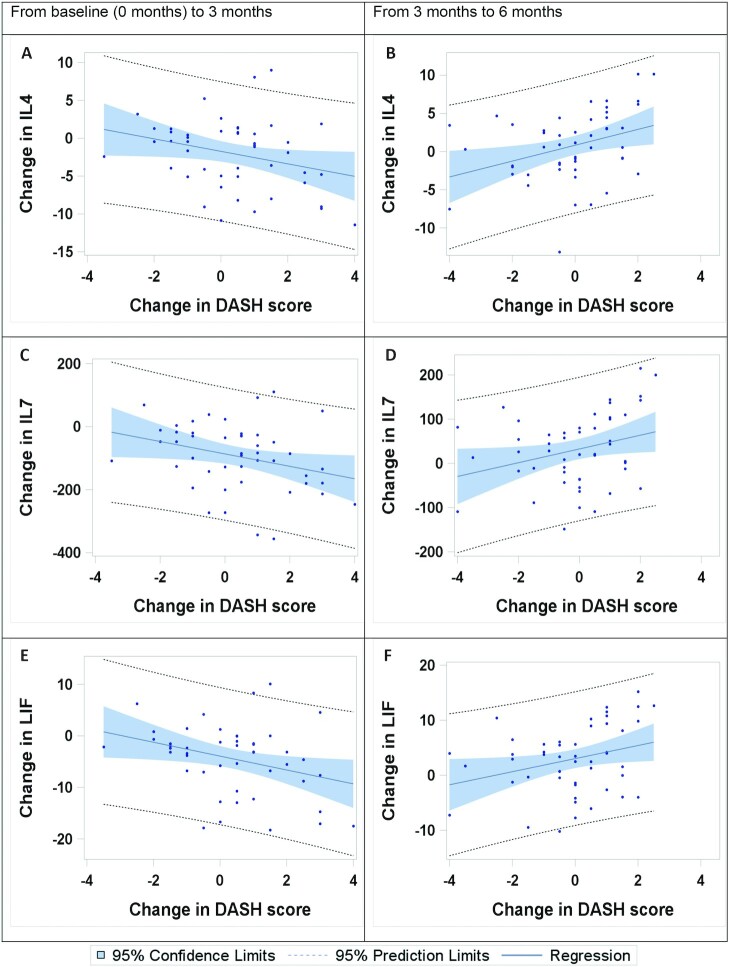
FIGURE 3.
Regression plots for changes in DASH score and changes in serum proteins from baseline (0 mo) to 3 mo (n = 47) and from 3 to 6 mo (n = 49). Plots are shown for the 3 markers demonstrating a significant (P < 0.05) correlation with the DASH scores for both time periods. Regression plots for changes in DASH score and IL-4 from baseline to 3 mo (A) and from 3 to 6 mo (B); for changes in DASH score and IL-7 from baseline to 3 mo (C) and from 3 to 6 mo (D); and for changes in DASH score and LIF from baseline to 3 mo (E) and from 3 to 6 mo (F). DASH, Dietary Approaches to Stop Hypertension; LIF, leukemia inhibitory factor.

