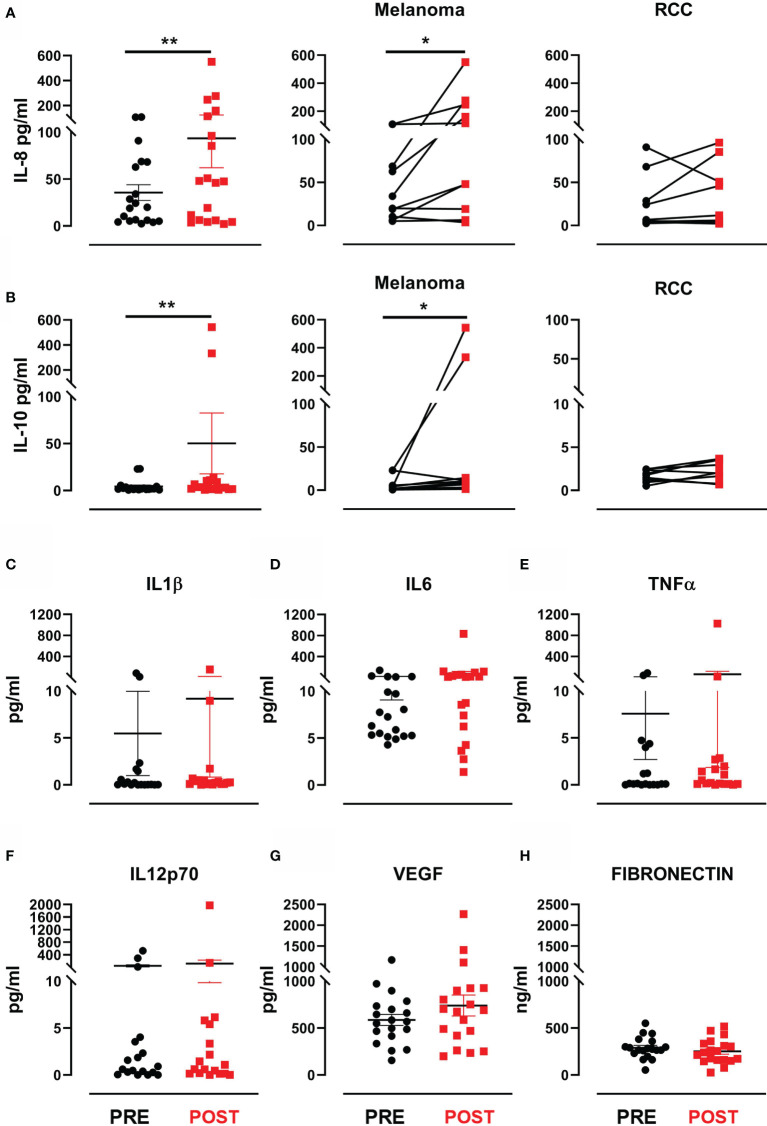
Figure 3.
Cytokines and proangiogenic factor modulation after treatment. (A) Dot plot with bar represents IL-8 concentration (pg/mL) in the entire patient cohort (left panel), in MM patients (middle panel) and in RCC patients (right panel). (B) Dot plot with bar represents IL-10 concentration (pg/mL) in the entire patient cohort (left panel), in MM patients (middle panel) and in RCC patients (right panel). Dot plots with bar represent pre- and post-therapy concentration levels (pg/mL) of (C) IL-1β, (D) IL-6, (E) TNF-α, (F) IL-12 p70, (G) VEGF and (H) fibronectin in ng/mL. Data represent individual values, mean (central bar) ± SEM (upper and lower bar). The black circular dots represent pre- therapy samples, while the red squares represent post-therapy samples. Statistical analysis was performed with the nonparametric Wilcoxon signed rank test; *p value < 0.05, **p value < 0.01.

