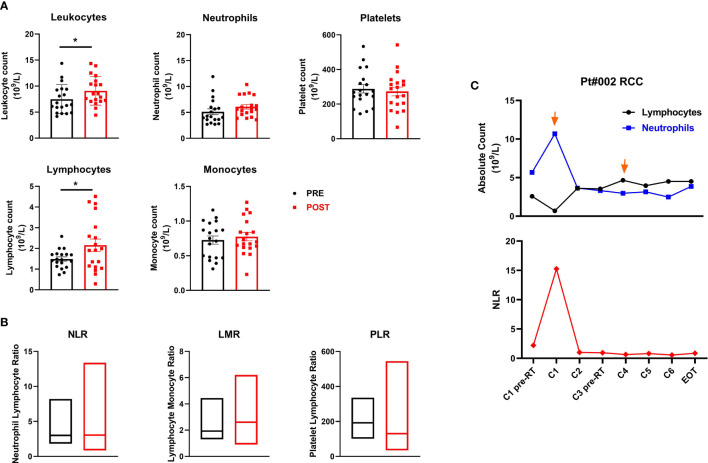
Figure 4.
Peripheral blood cell biomarkers of immune modulation. (A) Scatter plots with bars represent leukocyte, neutrophil, platelet, lymphocyte and monocyte counts (109/L) in peripheral blood collected before and after therapy. Data represent individual values, mean (central bar) ± SEM (upper and lower bar). The black circular dots represent pre- therapy samples, while the red squares represent post-therapy samples. (B) Boxes with floating bars represent neutrophil-to-lymphocyte ratio (NLR), lymphocyte-to-monocyte ratio (LMR) and platelet-to-lymphocyte ratio (PLR). The black and red boxes represent pre- and post-therapy values, respectively. (C) Trend of the absolute count of lymphocytes and neutrophils (upper panel) and the NLR (lower panel) during treatment cycles for patient #002 (RCC, partial responder). The black line and dots refer to the lymphocyte count, the blue line and dots to the neutrophil count and the red line and dots to the NLR. Statistical analysis was performed with the nonparametric Wilcoxon signed rank test; *p value < 0.05.

