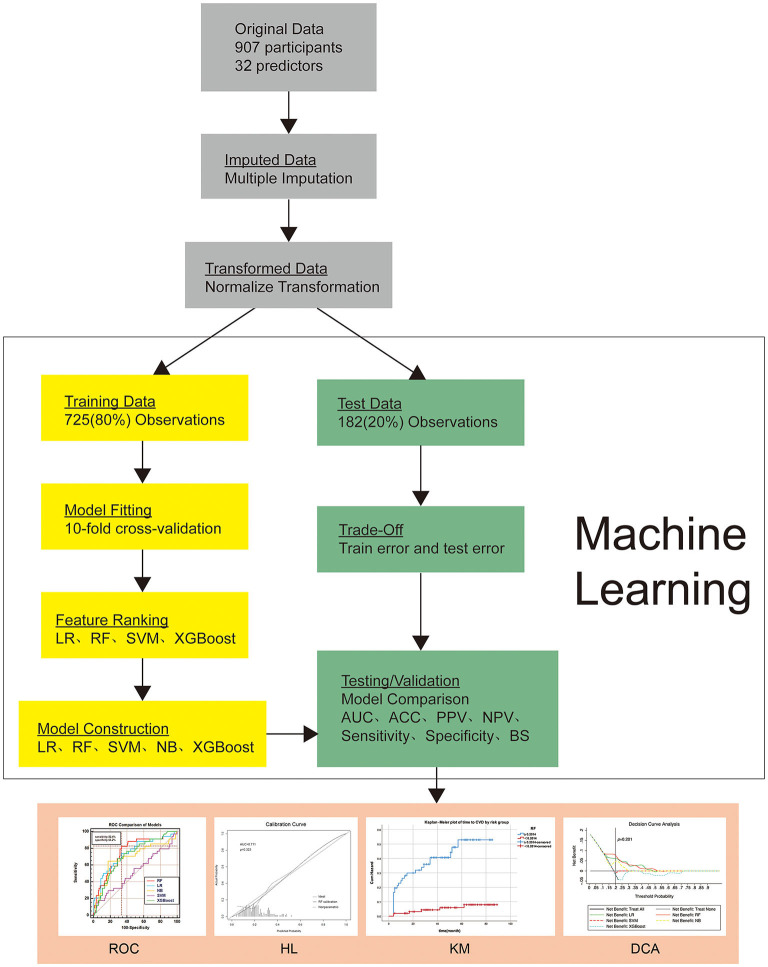
Figure 2.
Overview of the methods used for data extraction, training, and testing. ROC, Comparison of ROC AUC of five machine learning algorithms; KM, Kaplan–Meier plot of time to CVD by risk group; DCA, Decision curve analysis curve for the five machine learning algorithms. HL, Hosmer-Lemeshow goodness-of-fit test of the Random Forest model in the validation set. DCA: The y-axis measures the net benefit. Gray line (Treat None) represents the net benefit of outcomes (postpartum CVD) of non-intervention for all pregnant women; Black line (Treat All) represents the net benefits of outcomes of intervention for all pregnant women; Lines in different colors represent the risk stratification of preeclamptic women according to different machine learning algorithms. When intervention is given to high-risk women, the net benefit of postpartum CVD risk may be generated. The model with the highest net income under a specific threshold has the highest clinical value. CVD, Cardiovascular disease; LR, Logistic Regression; RF, Random Forest; SVM, Support Vector Machines with Linear Kernel; NB, Naive Bayes; XGBoost, Extreme Gradient Boosting algorithm; AUC, area under the curve; ACC, accuracy; BS, Brier Score; PPV, positive predictive values; NPV, negative predictive values; ROC, receiver operating characteristic curve; KM, Kaplan–Meier curve; DCA, decision curve analysis.

