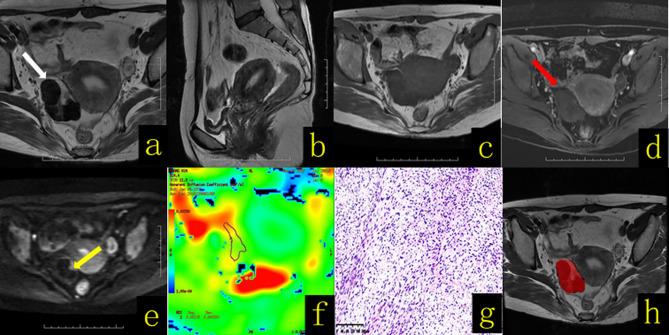
Figure 3.
A 65-year-old female patient with right ovarian thecoma–fibrothecoma. (A) Axial T2WI revealed a solid mass in the right adnexal region (white arrow), showing mainly a low-signal mass with a semiarc shape and high signal at the left front edge. (B) Sagittal T2WI showed thickening of the endometrium to a thickness of approximately 1.2 cm. (C) Axial T1WI revealed a solid mass with hypo–isointense signal (white arrow). (D) On contrast-enhanced fat-suppressed T1WI, the solid components (red arrow) of the lesion showed mild enhancement. (E) On DWI-MRI (b = 1,000 s/mm2), the solid part of the lesion of the left front edge appeared hyperintense (yellow arrow). (F) The apparent diffusion coefficient (ADC) map showed that the average ADC value of the diffuse high-signal area was approximately 1.78 × 10⁻³ mm2/s. (G) Hematoxylin and eosin (H&E) staining (×100) showed that the tumor was composed of spindle cells and collagen fibers arranged in a mat-like pattern with interwoven bundles, and hyaline degeneration of fibrous tissue bands and intercellular edema were observed to varying degrees. The tumor cell nucleus was fusiform to oval, with sparse cytoplasm and containing a small amount of lipids; the mitotic index was <3/10 HPF. (H) The texture analysis target area was delineated throughout the whole tumor layer by layer.

