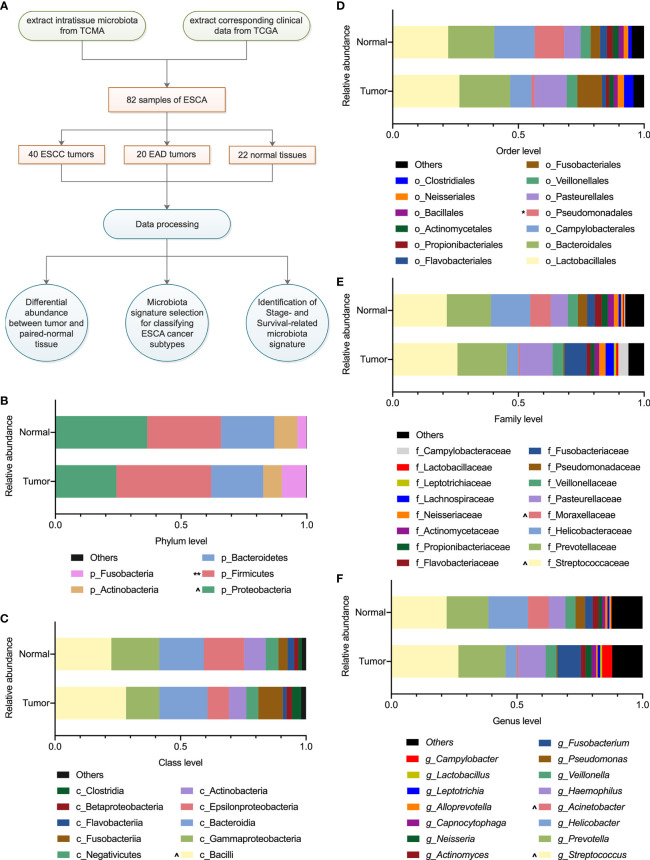
Figure 1.
Overview of the study design and microbiota profiling. (A) Schematic overview of the study design. TCMA, the cancer microbiome atlas; TCGA, the cancer genome atlas; ESCA, esophageal carcinoma; ESCC, esophageal squamous cell carcinoma; EAD, esophageal adenocarcinoma. (B–F) The composition of microbiota with an average abundance > 1% in tumor and paired normal tissues at the phylum, class, order, family, and genus levels, respectively. The relative microbial abundance in tumors compared with normal samples, ^0.1 < P < 0.01, *P < 0.05, **P < 0.01 in paired-samples t-test.

