
Figure 1.
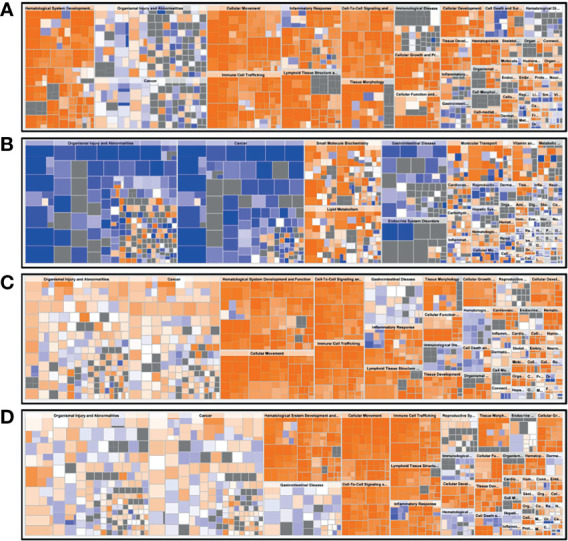
Biological trends for I-irAE, I-UC, A-irAE, and A-UC regions compared with normal samples. The size and color of each tile reflect the p value (−log) and the z-score, which reflect the overall predicted activation state (<0: inhibited, >0: activated), respectively, compared with the normal sample. The intensity scale of the z-score ranges from dark blue (low value) to dark orange (high value). (A) Featured canonical pathways of inactive irAE (n = 14) and normal control (n = 3). (B) Featured canonical pathways of inactive UC (n = 9) and normal control (n = 3). (C) Featured canonical pathways of active irAE (n = 15) and normal control (n = 3). (D) Featured canonical pathways of active UC (n = 9) and normal control (n = 3).