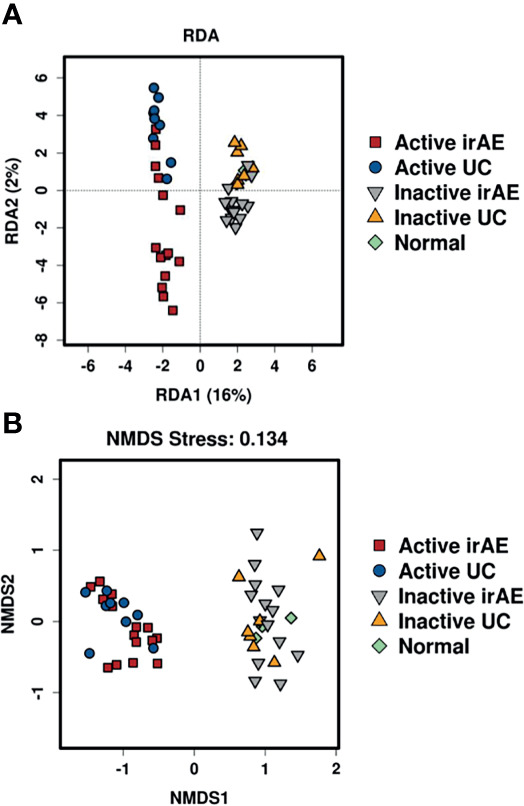
Figure 3.

Comparison of biodiversity indices between different groups of tissue microbiota. (A) Redundancy analysis (RDA) plot showing the relationship of inflammation and disease status. Plot at operational taxonomic units (OTUs) level. The contribution rate of each component is shown in parentheses. (B) Non-metric multidimensional scaling (NMDS) plot showing the relationship of inflammation and disease status. Plot at operational taxonomic units (OTUs) level. The NMDS stress value was 0.134, which is considered to be statistically reliable due to it is less than 0.2.
